Order Flow charts dated 19th Aug
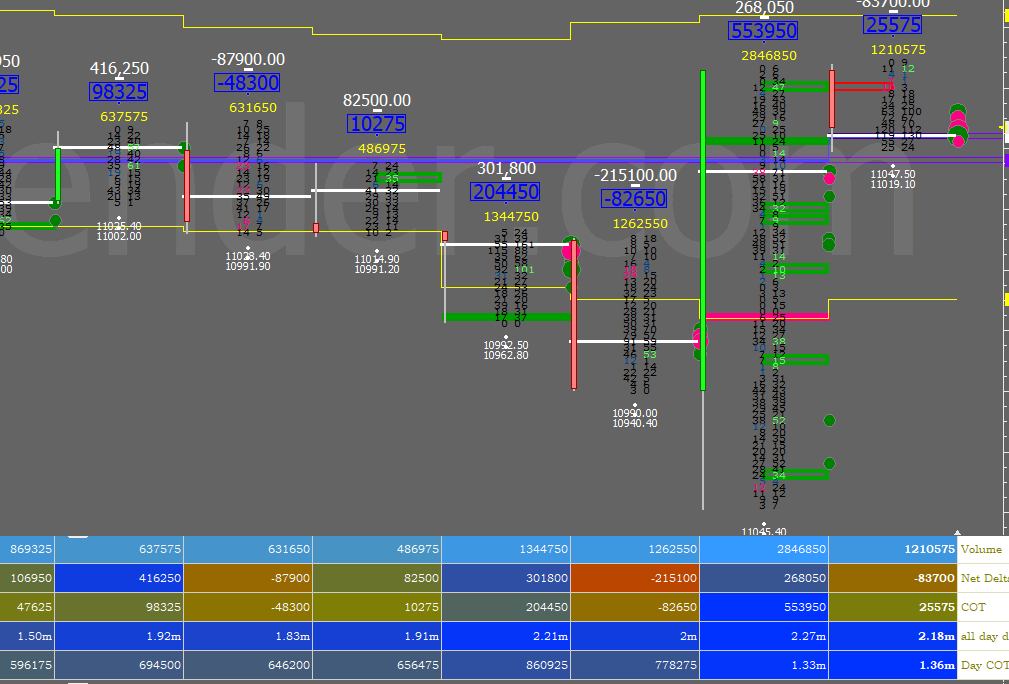
Many traders are used to viewing volume as a histogram beneath a price chart. This approach shows the amount of volume traded below the price Bar. The Order Flow approach is to see the Volume traded inside or within the price bar, an important distinction. Order Flow trading is thinking about what order market participants […]
Order Flow charts dated 19th Aug (5 mins)
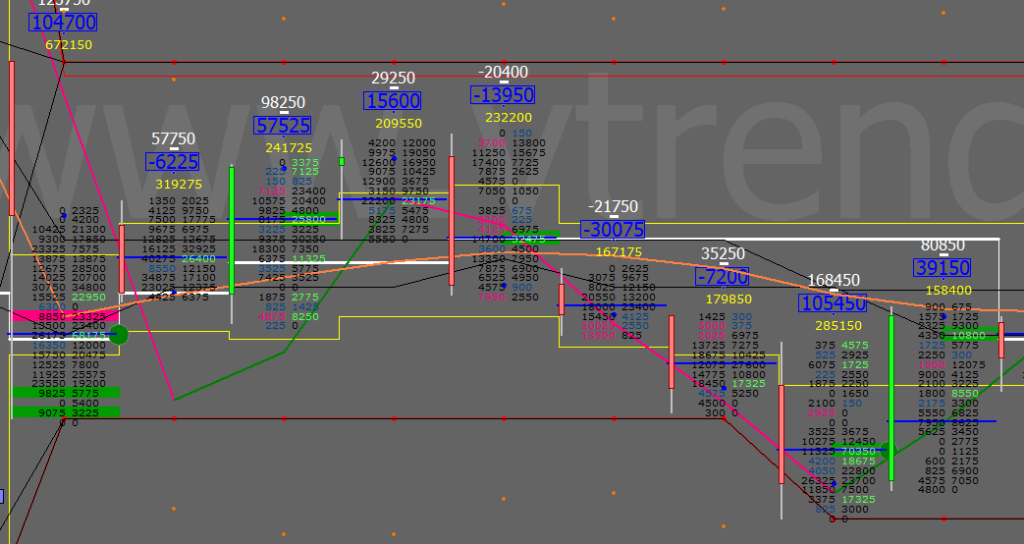
Order Flow can show how a collection of market participates has acted in the past and this helps to create profit by knowing if these traders are profitable or caught upside down. NF BNF
Market Profile Analysis dated 16th August
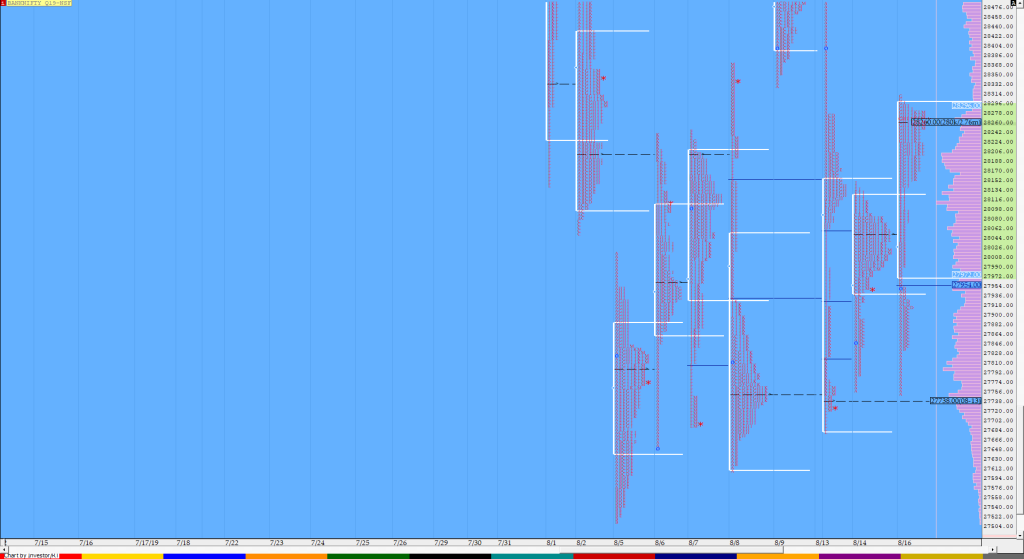
Nifty Aug F: 11065 [ 11094 / 10926 ] NF opened lower with a gap down of almost 70 points and went on to break the PDL (Previous Day Low) of 10935 at open as it made lows of 10925 but once again was swiftly rejected as it left a tail at lows from 10964 to […]
Weekly charts (12th to 16th August) and Market Profile Analysis
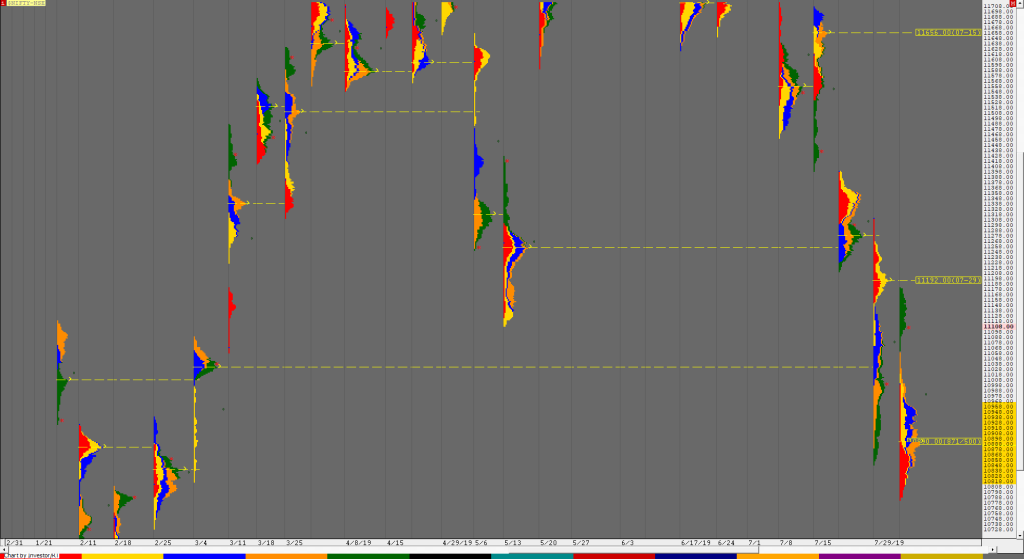
Nifty Spot Weekly Profile (12th to 16th August) Spot Weekly 11048 [ 11146 / 10901 ] Last week’s report ended with this ‘the close was away from Value so the coming week may see a balance being formed between the HVNs of 11192 & 10890‘ and this is what exactly happened this week as Nifty […]
Order Flow charts dated 16th Aug
A good trader is a one who can make money consistently over a longer period of time. But how to become one such trader, who can make money in any type of market condition? A good trader keeps a close watch on the current information of the market and assesses it for change against previous […]
Market Profile Analysis dated 14th August
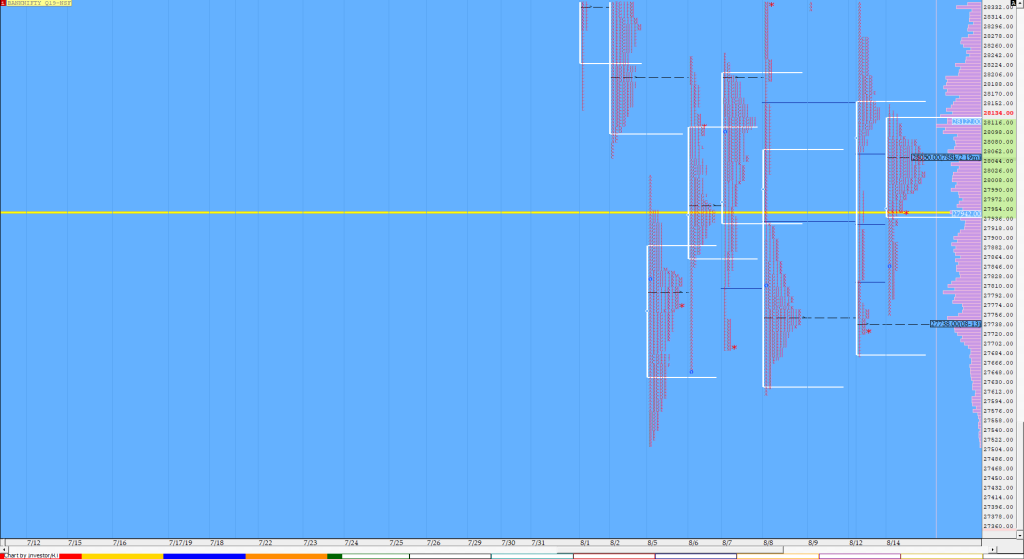
Nifty Aug F: 11028 [ 11100 / 10935 ] NF opened with a gap up almost 75 points but with a OH of 10999 indicating that the previous day’s sell off was more emotional and which invited lot of late shorts who were stuck & which probably caused this higher open. The auction then made a […]
Order Flow charts dated 14th Aug
Many traders are looking for information on how to use market conditions to find good trades. Order Flow is best understood as a way to see existing bias in the markets. Order Flow helps us understand who is in control of the market and who is ‘upside down’ and likely to make exits from that […]
Market Profile Analysis dated 13th August
Nifty Aug F: 10925 [ 11145 / 10910 ] NF opened in previous Value but could not sustain above the yPOC of 11120 as it gave a sharp probe lower in the A period breaking below PDL (Previous Day Low) to give a 99 point range in the first 30 minutes as it took support in […]
Order Flow charts dated 13th Aug
Many traders are used to viewing volume as a histogram beneath a price chart. But the Order Flow approach shows the amount of volume traded during each price bar, and also it breaks this volume down into the Volume generated by the Buyers and the Volume generated by the sellers again at every row of […]
Order Flow charts dated 13th Aug (5 mins)
An Order Flow trader can actually see exactly what is happening in the market as it happens. Once you are able to understand what is happening in the present, you are able to make far better decisions about what might happen in the future. Order Flow provides traders with vision into market activity. NF BNF
