Order Flow charts dated 15th October 2020

The key to using Order Flow trading is to determine market depth. This describes the places where Market participants have taken positions or the zone they have transacted. The Order Flow is like a list of trades and helps to know how other traders are placed in the market. Vtrender helps you to stay on […]
Participantwise Open Interest – 15th OCT 2020
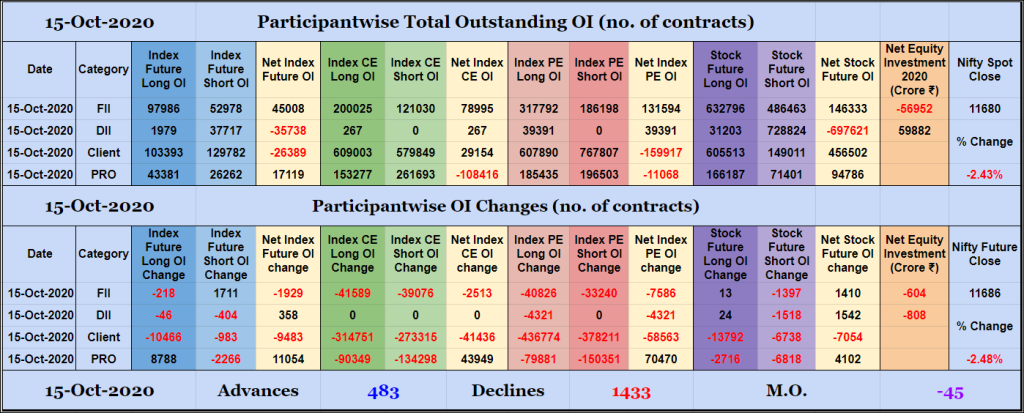
FIIs have added 1K short Index Futures contracts and reduced exposure in Index Options and Stocks Futures on weekly expiry. They were net sellers in equity segment for ₹604 crore.
Desi MO (McClellans Oscillator For NSE) – 15th OCT 2020
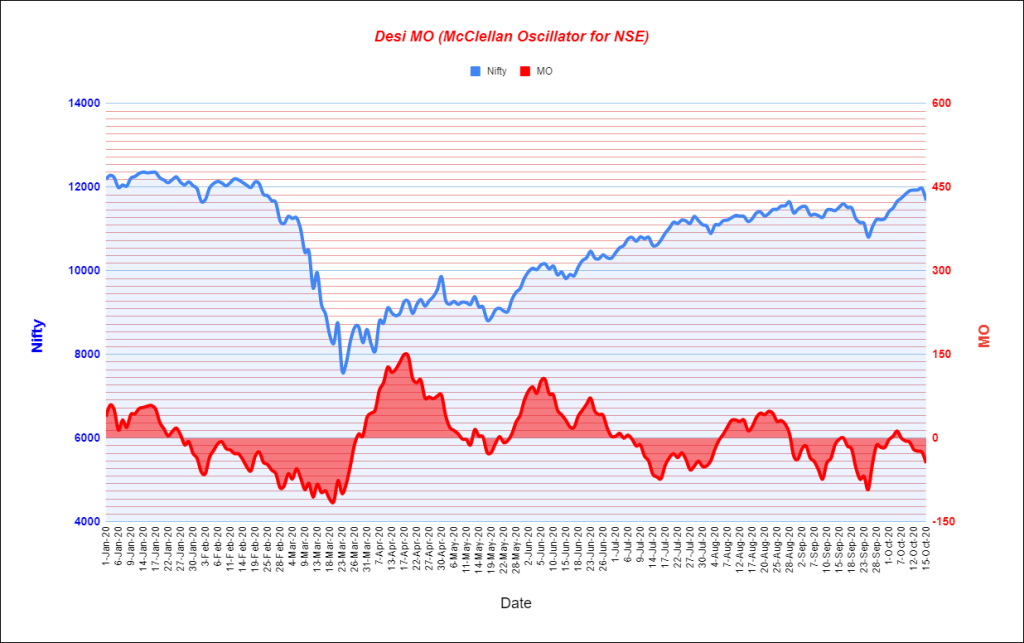
MO at -45
Market Profile Analysis dated 14th October 2020
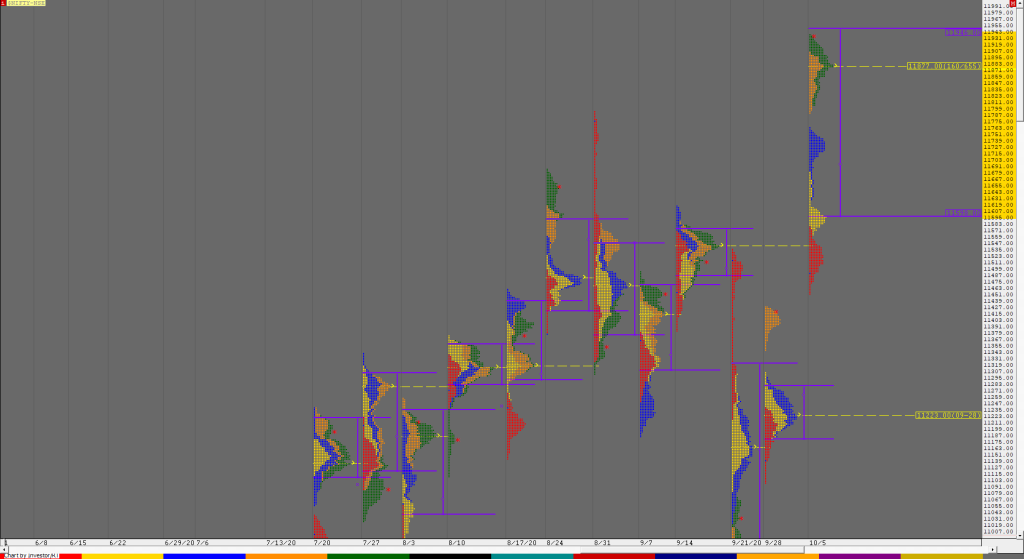
NF opened lower & got rejected from previous day’s Value as it made new lows for the week at 11835 in the IB (Initial Balance) and stayed below VWAP for the first half of thr day forming a ‘b’ shape profile and even made an attempt to make a RE (Range Extension) lower in the […]
Order Flow charts dated 14th October 2020

Trading Order Flow allows a trader to see the specific price where a trade has hit the market, along with the volume of that trade. This information is extremely valuable and allows a trader to generate substantial revenue by using this information to trade. The way we see it is that Order Flow trading is […]
Order Flow charts dated 13th October 2020

Many traders are used to viewing volume as a histogram beneath a price chart. This approach shows the amount of volume traded below the price Bar. The Order Flow approach is to see the Volume traded inside or within the price bar, an important distinction. Order Flow trading is thinking about what order market participants […]
Market Profile Analysis dated 12th October 2020

Nifty Oct F: 11938 [ 12014 / 11867 ] NF opened with an OL (Open=Low) start right at previous day’s high of 11950 continuing the previous week’s imbalance as it went on to make new highs for the series at 12014 in the opening minutes but settled down as an OAOR (Open Auction Out of […]
Order Flow charts dated 12th October 2020

A good trader is a one who can make money consistently over a longer period of time. But how to become one such trader, who can make money in any type of market condition? A good trader keeps a close watch on the current information of the market and assesses it for change against previous […]
Market Profile Analysis dated 09th October 2020

Nifty Oct F: 11930 [ 11950 / 11815 ] NF made an OAIR start and took support just above PDH (Previous Day High) as it left similar lows in the IB (Initial Balance) indicating limited downside after which it went on to make multiple REs (Range Extension) higher to close the week at new highs […]
Weekly charts (05th to 09th October 2020) and Market Profile Analysis
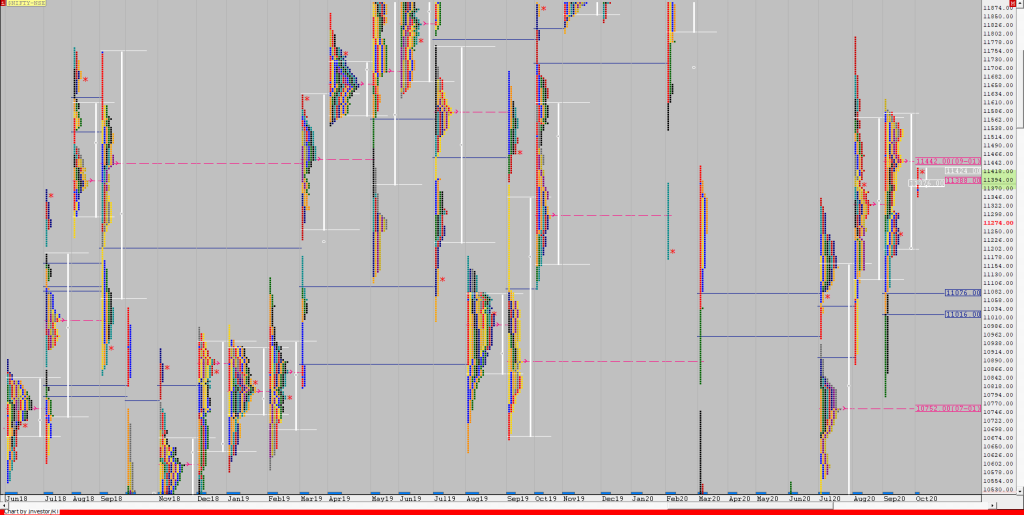
Nifty Spot Weekly Profile (05th to 09th Oct 2020) Spot Weekly – 11914 [ 11938 / 11452 ] Previous week’s report ended with this ‘The weekly range & value both are inside previous week and the profile resembles an incomplete DD (Double Distribution) with a nice lower distribution which forms this week’s Value of 11181-11223-11277 […]
