Nifty Nov F: 12096 [ 12107 / 11917 ]
HVNs – 11814 / 11852 / ( 11901) / 11914 / 11978 / 12030 / 12070
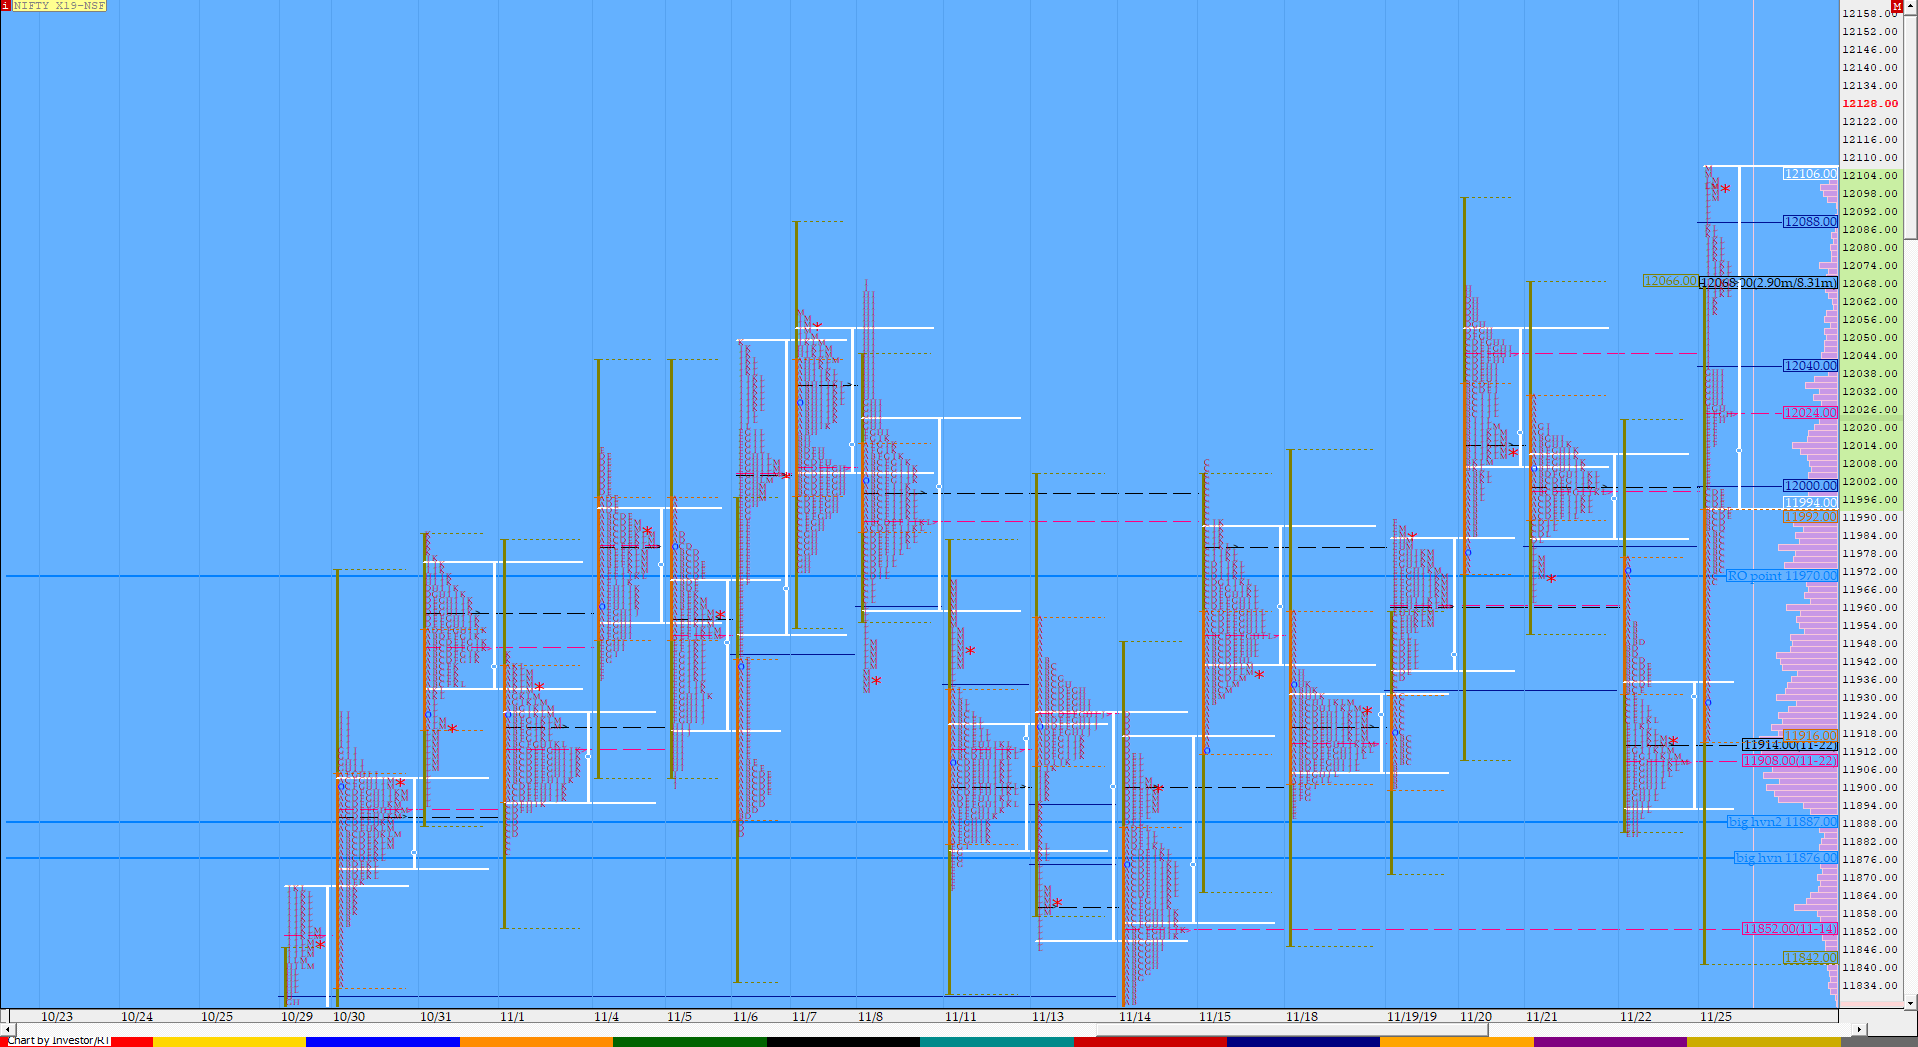
NF gave an initiative move away from the weekly as well as composite POC of 11918 at open indicating that OTF (Other Time Frame) has entered the market as it probed higher in the IB making a range of 75 points as it scaled above PDH to make highs of 11992. The auction then made a ‘C’ side extension to the upside but got stalled at the 12k mark as it made an inside bar in the ‘D’ period starting to form a ‘p’ shape profile for the day with a long buying tail from 11968 to 11917 which meant that the PLR is to the upside. NF then made a fresh RE to the upside in the ‘E’ period leaving an extension handle at 11999 followed by higher highs in the next 2 periods which gave strong signals that a Trend Day set up is in place. The ‘H’ period gave a very small pull back to 12014 but was still way above VWAP which meant that all the dips were getting bought into and this led to a fresh RE in the ‘I’ period as the auction left a second extension handle for the day at 12039 and went on to complete the 2 IB move higher of 12067 as it made highs of 12082 and in the process also making new high for the series. The ‘J’ & ‘K’ periods consolidated in a small range making made marginally higher highs as NF hit 12087 but started to consolidate in a very narrow range & this led to an inventory adjustment move at the closing of the ‘K’ period as it left a higher PBL (Pull Back Low) at 12059 but once again this dip saw demand coming in. The ‘L’ period then resumed the one time frame move up as it made a fresh RE leaving the third extension handle of the day at 12087 and went on to make highs of 12107 at close leaving a Triple Distribution Trend Day Up. The auction has HVNs at 12070, 12030 & 11978 which will be the important references on the downside along with today’s VWAP of 12023 for the remaining part of the series.
Click here to view NF move away from the 16 day composite (31st Oct – 22nd Nov)
- The NF Open was an Open Test Drive – Up (OTD)
- The day type was a Trend Day – Up (TD)
- Largest volume was traded at 11978 F
- Vwap of the session was at 12023 with volumes of 116.8 L and range of 189 points as it made a High-Low of 12107-11917
- The Trend Day VWAP of 25/11 at 12023 will be important reference on the downside.
- The Trend Day VWAP of 29/10 at 11810 will be important reference on the downside.
- NF confirmed a multi-day FA at 11465 on 16/10 and completed the 2 ATR move up of 11776. This FA has not been tagged since & hence is now positional support
- NF confirmed a FA at 11503 on 17/10 and completed the 2 ATR move up of 11808. This FA has not been tagged since & hence is now positional support
- NF confirmed a FA at 11162 on 09/10 and completed the 2 ATR move up of 11554. This FA has not been tagged since & hence is now positional support
- The settlement day Roll Over point (Nov) is 11970
- The VWAP & POC of Oct Series is 11461 & 11365 respectively.
- The VWAP & POC of Sep Series is 11127 & 10960 respectively.
- The VWAP & POC of Aug Series is 10966 & 10984 respectively.
You can check the monthly charts & other swing levels for Nifty & NF here & for the weekly charts & analysis, please click here.
Daily Zones:
- Value zones (volume profile) are at 11921-11978-12065
Hypos / Estimates for the next session:
a) NF needs to scale above 12119 for a move to 12148-166 / 12185 & 12209-215
b) Immediate support is at 12080 below which the auction could test 12058-39 / *12023*-12 & 11994
c) Above 12215, NF can probe higher to 12233 / 12248-255 & 12282
d) Below 11994, auction becomes weak for 11978 / 11960 & 11914*
e) If 12282 is taken out, the auction go up to to 12310 / 12340 & 12375-384
f) Break of 11914 can trigger a move lower to 11901-885 / 11860-852* & 11833
BankNifty Nov F: 31568 [ 31590 / 31049 ]
HVNs – 31020 / 31145/ (31290) / 31330-360 / 31530 / 31585
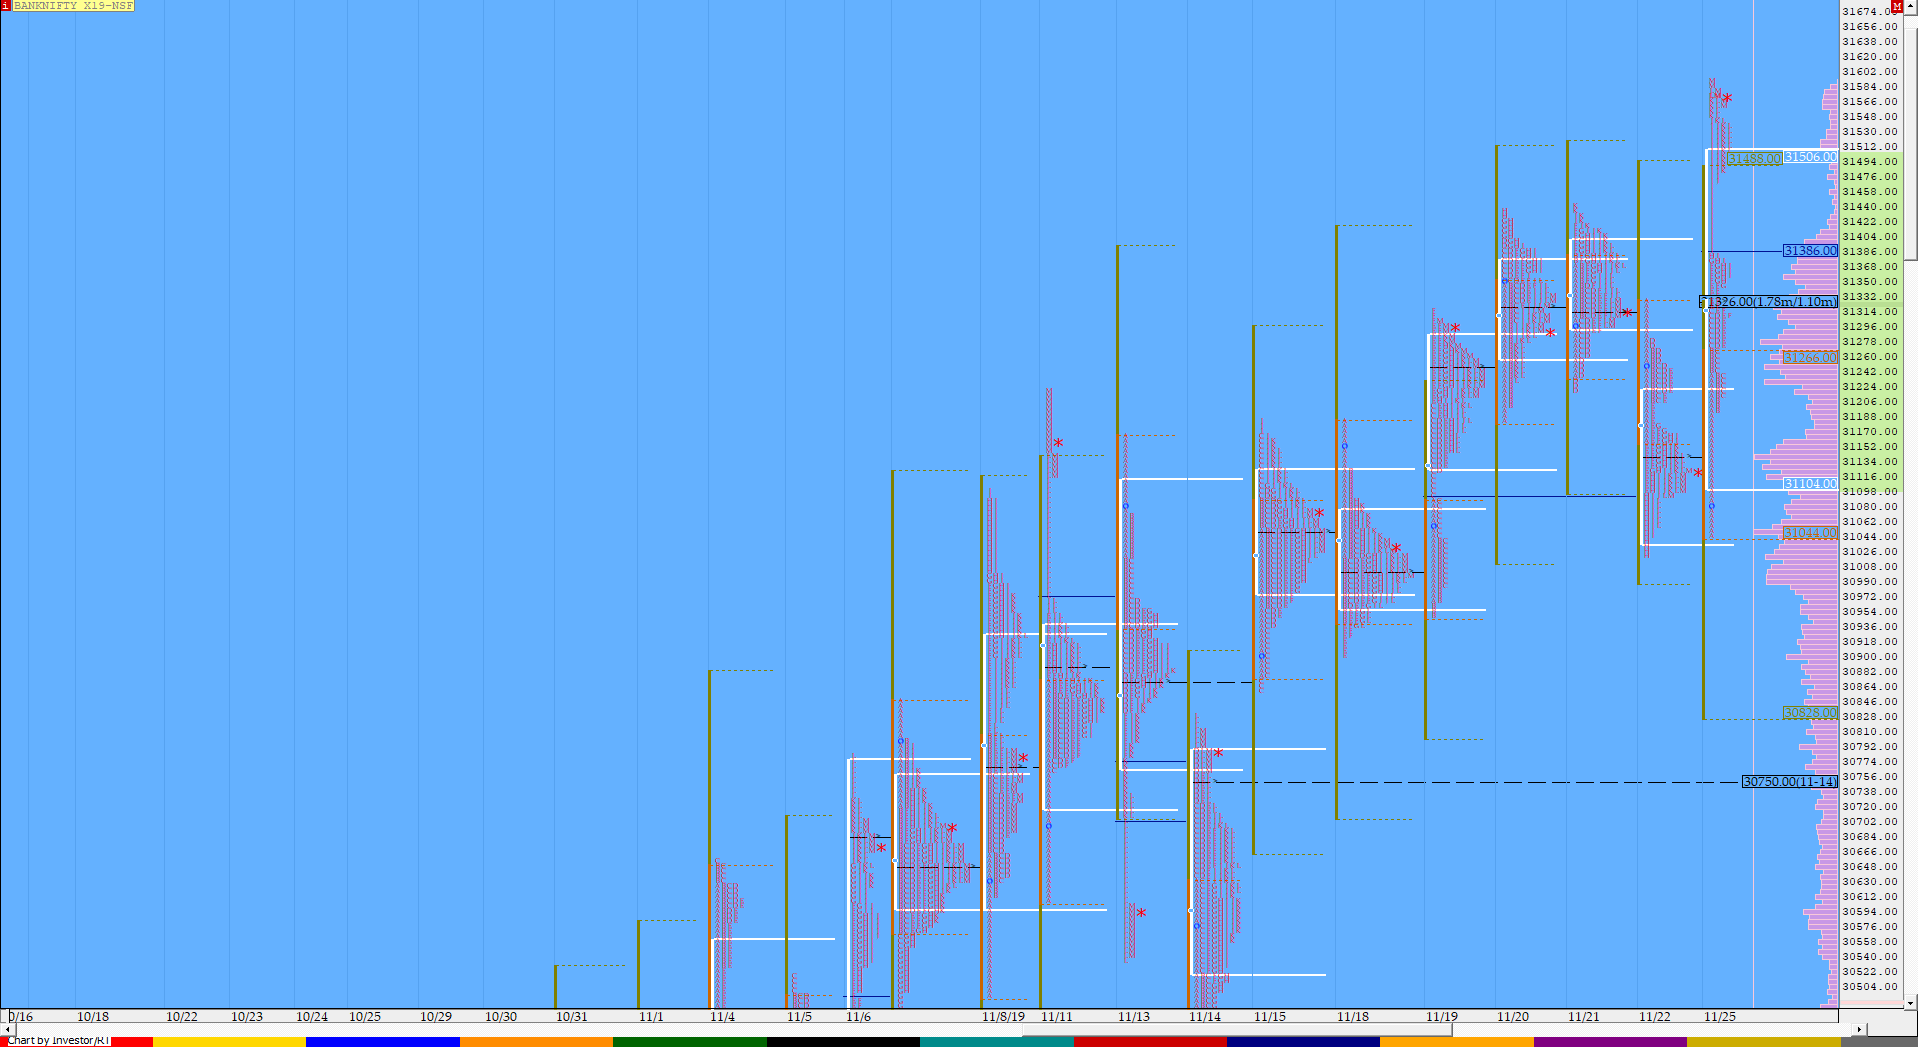
BNF had a more sedate start as it remained in previous day’s range in the IB after it gave an OAIR start making a range of 221 points which included a 150+ point buying tail from 31205 to 31049. The auction then made a ‘C’ side extension as it left a small extension handle at 31269 and got above the HVN & Friday’s supply point of 31280 while making new highs for the day at 31318. The ‘D’ period then made a narrow range inside bar after which BNF made a fresh RE on the upside in the ‘E’ period and went on to make an one time frame move higher till the close making new highs in each TPO as it left another extension handle at 31382 in the ‘I’ period which also signaled the initiative move away from the 4-day composite it was forming as the profile left singles from 31471 to 31382 and went on to make highs of 31590 in the closing period. Immediate support in the coming session would be at the dPOC of 31530 below which the zone of 31356-330 will be the more important demand zone to hold for BNF to continue higher.
(Click here to view BNF move away from a 4-day composite)
- The BNF Open was an Open Auction In Range (OAIR)
- The day type was a Trend Day – Up (TD)
- Largest volume was traded at 31530 F
- Vwap of the session was at 31356 with volumes of 29.9 L and range of 541 points as it made a High-Low of 31590-31049
- The Trend Day VWAP of 25/11 at 31356 will be important reference on the downside.
- BNF confirmed a FA at 31224 on 21/11 which got negated on 22/11.
- The Trend Day VWAP of 06/11 at 30447 will be important reference on the downside.
- BNF had confirmed a FA at 30052 on 06/11 and tagged the 2 ATR target of 31049 on 08/11. This FA has not been tagged since & hence is now positional support
- The Trend Day VWAP of 29/10 at 29945 will be important reference on the downside. This was tagged on 30/10 and broken but was swiftly rejected so proves to be support.
- BNF confirmed a FA at 27900 on 09/10 and completed the 2 ATR move up of 29779. This FA has not been tagged since & hence is now positional support
- The settlement day Roll Over point (Nov) is 30150
- The VWAP & POC of Oct Series is 28784 & 28415 respectively.
- The VWAP & POC of Sep Series is 28416 & 27160 respectively.
- The VWAP & POC of August Series 27858 & 27960 respectively
For the Monthly charts & other swing levels for BankNifty & BNF click here & for the weekly charts & analysis, please click here.
Daily Zones:
- Value zones (volume profile) are at 31292-31530-31589
Hypos / Estimates for the next session:
a) BNF needs to sustain above 31585 for a rise to 31625-680 / 31727-740 & 31784*-803
b) Immediate support is at 31530 below which the auction could test 31470 / 31390-380 & 31330
c) Above 31803, BNF can probe higher to 31852-908 / 32001 & 32045-58
d) Below 31330, lower levels of 31280-269 / 31215 & 31145-100 could be tagged
e) If 32058 is taken out, BNF can give a fresh move up to 32107-140 / 32197-213 & 32277-299
f) Below 31100, we could see lower levels of 31049-20 / 30965-914 & 30860
For more tradeable ideas and intraday trading strategies based on MarketProfile and the OrderFlow live charts with OrderFlow analysis Live, subscribe to the trading room. The Vtrender Trading Room hosts India’s largest MarketProfile community live every trading session from 9.15 am to 3.30 pm.
If not a Trading Room member you can get immediate access at – https://in.explara.com/e/vtrender–trading–room/checkout


