• 9284331270
  • support@vtrender.com
  • Log In
Vtrender
  • 9284331270
  • support@vtrender.com
  • Log In
  • Home
  • Features
  • Forum
  • Pricing
  • The Vtrender Trading Room Mentorship Program
  • Training Library
  • About Us
  • Market Profile Charts
  • MarketProfile Ecourse
  • Home
  • Features
  • Forum
  • Pricing
  • The Vtrender Trading Room Mentorship Program
  • Training Library
  • About Us
  • Market Profile Charts
  • MarketProfile Ecourse

Monthly (February 2020) charts and Market Profile analysis

March 7, 2020March 7, 2020 admin 1 Blog
Bn Monthly Monthly (February 2020) Charts And Market Profile Analysis Banknifty Futures, Charts, Day Trading, Intraday Trading, Intraday Trading Strategies, Market Profile, Market Profile Trading Strategies, Nifty Futures, Order Flow Analysis, Support And Resistance, Technical Analysis, Trading Strategies, Volume Profile Trading

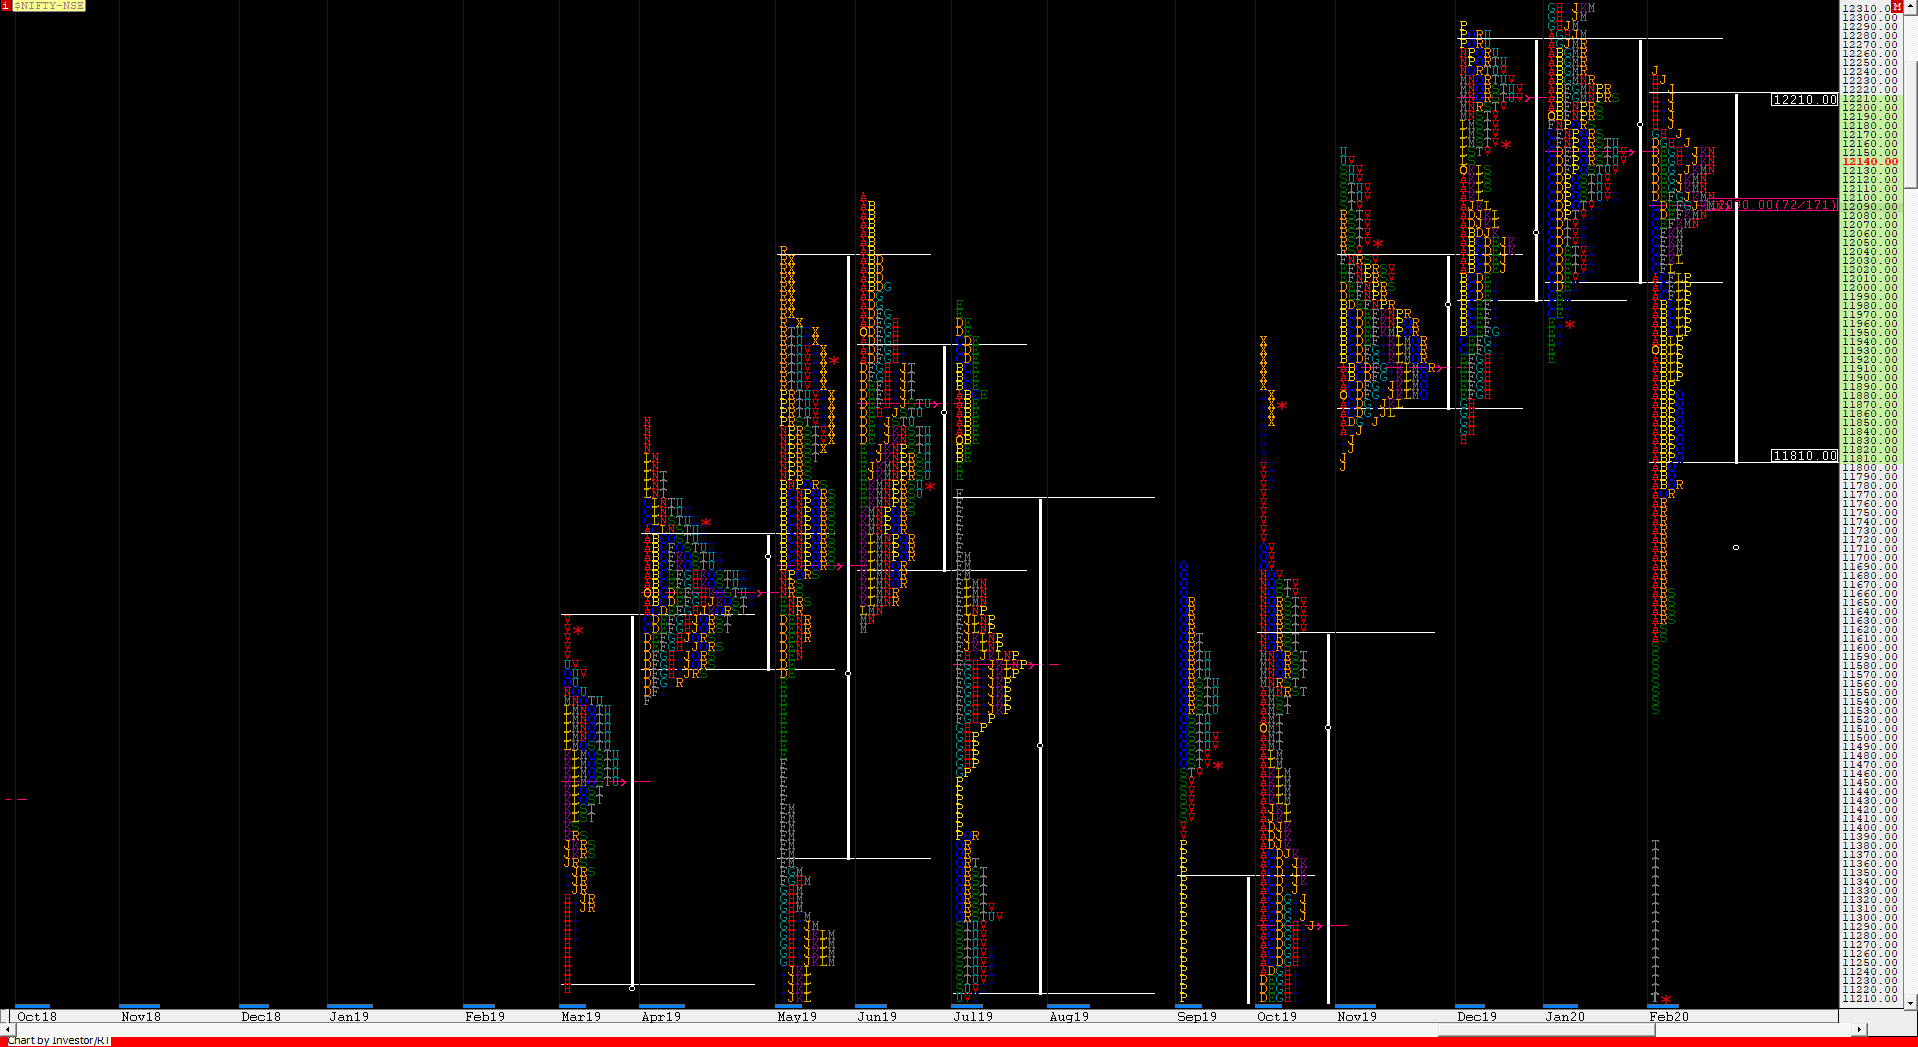
Nifty Spot – 11201 [ 12247 / 11175 ]

Monthly Profile (February 2020)

Previous month’s report ended with this ‘The monthly profile is a well balanced one with the Value similar to that of previous month but the excess at top & close around the lows has set up the coming month for a big move to the downside where Nifty could make an attempt to enter the Value of October and tag the monthly VPOCs of 11290 & 10960.‘

February started with the budget day which opened below the monthly Value & dropped by a huge range of 384 points after confirming a FA at 12017 as it made lows of 11633. The auction made a lower low on 3rd Feb at 11614 but took support right above the October monthly VAH of 11610 which was a sign that the imbalance to the downside was ending and this led to a probe to the upside in the next 3 days as Nifty got back into the previous month’s Value and went on to tag the monthly POC of 12160 to the dot on 6th Feb completing half of the 80% Rule and then gave a retracement to the monthly VAL of 12020 as it made lows of 11991 on 10th Feb but got back into the monthly Value into the close triggering a fresh 80% Rule in the monthly Value and this time it went on to get above the POC of 12160 and looked set to tag the VAH of 12280 but got stalled at 12247 on 14th Feb indicating that the upside probe was coming to a close. This in turn initiated the reverse 80% Rule in the well balanced monthly profile of Jan as Nifty not only broke below the POC of 12160 but went on to get below the VAL of 12020 as it made a low of 11908 on 18th Feb. This 300+ point move down led to a retracement over the next 2 days as the auction got back into the monthly Value but got stalled at 12152 right below the POC which was a sign that the PLR is still to the downside. Nifty then made a trending move lower in the last week of February leaving a Neutral Extreme profile on the monthly time frame as it made new lows for the month getting into October’s Value completing the 80% Rule in the same and in the process tagged that monthly VPOC of 11290 on 28th Feb closing the month in a spike down from 11614 to 11175. The monthly Value was at 11810-12090-12210 which was once overlapping with the previous 3 months giving a nice 4-month balance with Value at 11874-12132-12214.

Click here to view the 4-month composite along with the spike close of the month which did the 80% Rule in October’s Value Area.

N Monthly Monthly (February 2020) Charts And Market Profile Analysis Banknifty Futures, Charts, Day Trading, Intraday Trading, Intraday Trading Strategies, Market Profile, Market Profile Trading Strategies, Nifty Futures, Order Flow Analysis, Support And Resistance, Technical Analysis, Trading Strategies, Volume Profile Trading

Monthly Zones:

The VWAP of the February series is at 11944 spot and the POC is at 12125
The settlement day (Mar) rollover volume point is at 11610 F.

The VWAP of the January series is at 12178 spot and the POC is at 12132
The settlement day (Feb) rollover volume point is at 12044 F.

The VWAP of the December series is at 12087 spot and the POC is at 12182
The settlement day (Jan) rollover volume point is at 12193 F.

The VWAP of the November series is at 11954 spot and the POC is at 11910
The settlement day (Dec) rollover volume point is at 12153 F.

The VWAP of the October series is at 11461 spot and the POC is at 11365
The settlement day (Nov) rollover volume point is at 11970 F.

The VWAP of the September series is at 11127 spot and the POC is at 10960
The settlement day (Oct) rollover volume point is at 11630 F.


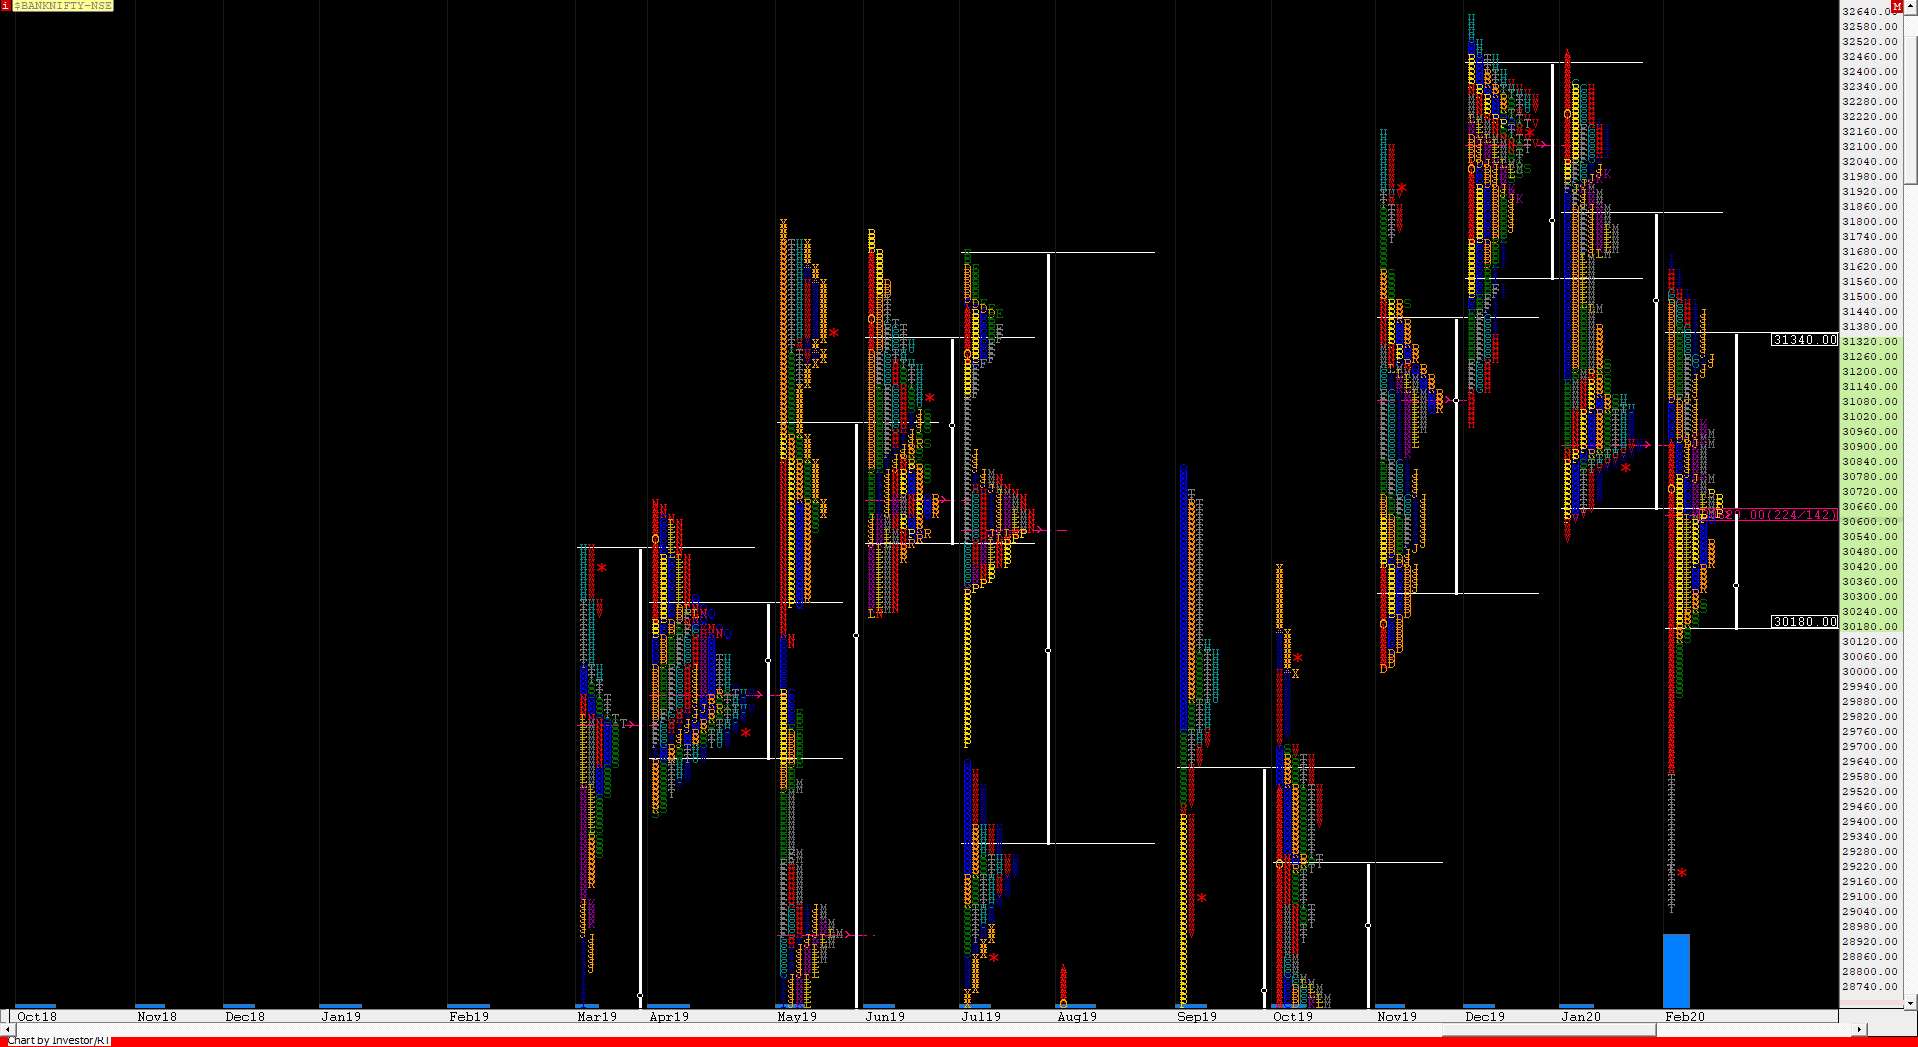
BankNifty Spot – 29147 [ 31649 / 29051 ]

Monthly Profile (February 2020)

Previous month’s report ended with this ‘The monthly Value was mostly lower & expanding to 30660-30900-31860 and acceptance below 30660 could lead to a test of October monthly spike low of 29693 below which we have that month’s VAH of 29220 and the monthly VPOCs of 28540 & 27160 as probable targets in the month(s) to come.‘

BankNifty also opened this month with a FA at 30918 on the Budget Day (1st Feb) and this coupled with the rejection from previous month’s POC of 30900 led to a huge move down of 1166 points on that day followed by the test of October’s spike low of 29693 on 3rd Feb as it made a low of 29612 but gave a bounce back to close above 30000. The auction then probed higher making new highs for the month as it got above the daily FA of 30918 on 5th Feb and took support exactly at the same level the next day after which it went on to make highs of 31470. BankNifty then made a retracement to 30957 over the next 2 days but stayed above that 30918 level indicating that the upside probe is still not over and this confirmation came after the auction then started a new leg to the upside and made new highs for the month at 31649 on 13th Feb but left a multi day FA there which led to a trending move on the downside for the next 3 days as BankNifty broke below that 30918-30900 zone and went on to make low of 30252 on 18th Feb. This imbalance of almost 1400 points then led to a bounce to 31085 on 20th Feb but the trend which had clearly changed to the downside resumed in the last week of Feb which opened with a gap down and stayed below the 30660 level and not only make new lows for the month but went on to tag the October VAH of 29220 on the last day as it made lows of 29050 before closing the month at 29147 leaving a Neutral Extreme profile for February 2020. This month’s Value was overlapping to lower at 30180-30620-31340 and the immediate reference for the next month would be the spike close of 29051 to 29914.

Bn Monthly Monthly (February 2020) Charts And Market Profile Analysis Banknifty Futures, Charts, Day Trading, Intraday Trading, Intraday Trading Strategies, Market Profile, Market Profile Trading Strategies, Nifty Futures, Order Flow Analysis, Support And Resistance, Technical Analysis, Trading Strategies, Volume Profile Trading

Monthly Zones:

The VWAP of the February series is at 30692 spot and the POC is at 30692
The settlement day (Mar) rollover volume point is at 30520 F.

The VWAP of the January series is at 31425 spot and the POC is at 32104
The settlement day (Feb) rollover volume point is at 30726 F.

The VWAP of the December series is at 31956 spot and the POC is at 32102
The settlement day (Jan) rollover volume point is at 32180 F.

The VWAP of the November series is at 30699 spot and the POC is at 31110
The settlement day (Dec) rollover volume point is at 32160 F.

The VWAP of the October series is at 28784 spot and the POC is at 28415
The settlement day (Nov) rollover volume point is at 30150 F.

The VWAP of the September series is at 28416 spot and the POC is at 27160
The settlement day (Oct) rollover volume point is at 30230 F.

BankNifty Futures charts day trading intraday trading intraday trading strategies market profile Market Profile Trading Strategies Nifty Futures order flow analysis support and resistance technical analysis Trading strategies volume profile trading

Post navigation

Order Flow charts dated 6th Mar 2020
Desi MO (McClellans Oscillator For NSE) – 6th MAR 2020

Most Read Post

  • Mastering Volume Profile Trading: Understanding HVNs and LVNs in the NSE FnO
  • A look at Market Structure ahead of the new October series
  • Testimonials
  • Make TIME your friend in the markets
  • 3 new videos in the Training Library
  • StressFree trading with #Orderflow
  • Training Library refurbished with new strategies
  • Give a man a fish…
  • The 4 stages of a Trader’s Life. Which one are you in?
  • What is exactly the Orderflow?
  • Data drives everything
  • Volume Spikes – How to exploit them
  • Market Profile The evolution
  • Random Musings on Market Profile
  • Order Flow Analysis – Strategies used to trade
  • How a Market Profile chart gives an edge to trade
  • Level 1- Market Profile Essentials
  • Market profile Trading strategies – Open Outside Ranges
  • Why I trust an OrderFlow chart…
  • Risk Management on Calls
  • OrderFlow Knowledge Base
  • Trading room charts explained
  • IB Extension Set Up- The C Side
  • Vix – Nifty Range Explained
  • Nifty Daily Stats ( IB Breakouts)
  • Nifty – MarketProfile trading strategies- The IB
  • Nifty daily stats ( 1 )
  • Spike Rules
  • Of Failed Auctions and revisits ( FA )
  • Steidlmayer Distribution
  • Market Profile-Day types

Archives

  • June 2023 (26)
  • May 2023 (121)
  • April 2023 (103)
  • March 2023 (110)
  • February 2023 (32)
  • January 2023 (33)
  • December 2022 (35)
  • November 2022 (32)
  • October 2022 (36)
  • September 2022 (41)
  • August 2022 (38)
  • July 2022 (40)
  • June 2022 (41)
  • May 2022 (39)
  • April 2022 (32)
  • March 2022 (34)
  • February 2022 (32)
  • January 2022 (36)
  • December 2021 (38)
  • November 2021 (31)
  • October 2021 (32)
  • September 2021 (35)
  • August 2021 (31)
  • July 2021 (37)
  • June 2021 (35)
  • May 2021 (79)
  • April 2021 (111)
  • March 2021 (55)
  • February 2021 (51)
  • January 2021 (54)
  • December 2020 (55)
  • November 2020 (52)
  • October 2020 (57)
  • September 2020 (77)
  • August 2020 (117)
  • July 2020 (95)
  • June 2020 (117)
  • May 2020 (104)
  • April 2020 (94)
  • March 2020 (111)
  • February 2020 (102)
  • January 2020 (116)
  • December 2019 (67)
  • November 2019 (64)
  • October 2019 (60)
  • September 2019 (69)
  • August 2019 (65)
  • July 2019 (73)
  • June 2019 (64)
  • May 2019 (83)
  • April 2019 (80)
  • March 2019 (83)
  • February 2019 (84)
  • January 2019 (95)
  • December 2018 (78)
  • November 2018 (75)
  • October 2018 (85)
  • September 2018 (65)
  • August 2018 (65)
  • July 2018 (76)
  • June 2018 (87)
  • May 2018 (85)
  • April 2018 (72)
  • January 2018 (4)
  • March 2016 (33)
  • February 2016 (90)
  • January 2016 (92)
  • December 2015 (50)
  • November 2015 (75)
  • October 2015 (87)
  • September 2015 (88)
  • August 2015 (89)
  • July 2015 (91)
  • June 2015 (83)
  • May 2015 (49)
  • April 2015 (42)
  • March 2015 (47)
  • February 2015 (41)
  • January 2015 (42)
  • December 2014 (44)
  • November 2014 (35)
  • October 2014 (35)
  • September 2014 (47)
  • August 2014 (31)
  • July 2014 (36)
  • June 2014 (23)
  • May 2014 (21)
  • April 2014 (21)
  • March 2014 (43)
  • February 2014 (40)
  • January 2014 (14)
  • December 2013 (1)
  • November 2013 (8)
  • October 2013 (8)
  • September 2013 (10)
  • August 2013 (11)
  • July 2013 (4)
  • June 2013 (4)
  • May 2013 (22)
  • April 2013 (30)
  • March 2013 (15)
  • February 2013 (20)
  • January 2013 (20)
  • December 2012 (13)
  • November 2012 (13)
  • October 2012 (33)
  • September 2012 (16)
  • August 2012 (11)
  • July 2012 (35)
  • June 2012 (56)
  • May 2012 (57)
  • April 2012 (34)
  • March 2012 (42)
  • February 2012 (27)
  • January 2012 (24)
  • December 2011 (36)
  • November 2011 (50)
  • October 2011 (34)
  • September 2011 (45)
  • August 2011 (60)
  • July 2011 (60)
  • June 2011 (47)
  • May 2011 (56)
  • April 2011 (47)
  • March 2011 (61)
  • February 2011 (62)
  • January 2011 (77)
  • December 2010 (37)
  • November 2010 (68)
  • October 2010 (75)
  • September 2010 (56)
  • August 2010 (44)
  • July 2010 (32)
  • June 2010 (32)
  • May 2010 (45)
  • April 2010 (14)
  • March 2010 (22)
  • February 2010 (12)
  • January 2010 (12)

About Us

The Vtrender Trading room specializes in Nifty and Bank Nifty future. We have charts Of Market Profile and Order Flow Charts + Live analysis + Live commentary + live trades.

We apply he concepts of Market Profile and the Order Flow to the NO and the Bank Nifty.

Explore

  • About Us
  • Forum
  • Pricing
  • The Vtrender Trading Room Mentorship Program
  • Features
  • Training Library

Forum

  • Market Profile Analysis dated 06th June 2023 June 6, 2023
  • Participantwise net Open Interest and net equity investments – 6th JUN 2023 June 6, 2023

Address

  • 9511921975
  • support@vtrender.com

Copyright @ 2009 - 2021 Vtrender Inc. All Rights Reserved.

whatsapp whatsapp