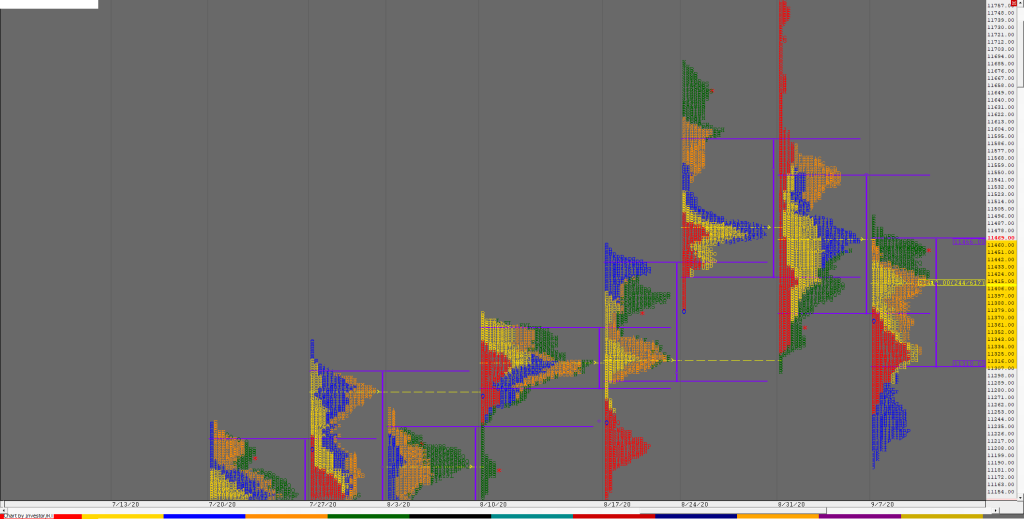
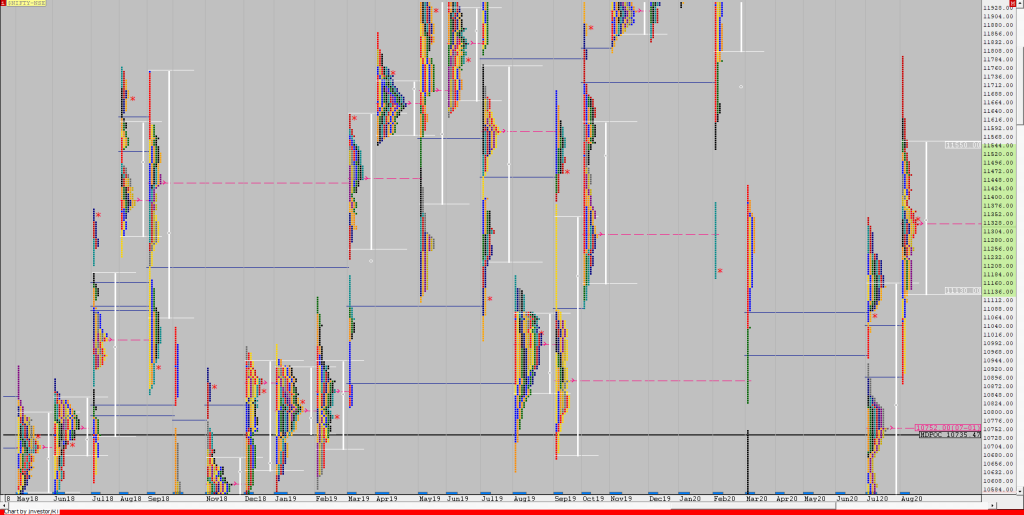
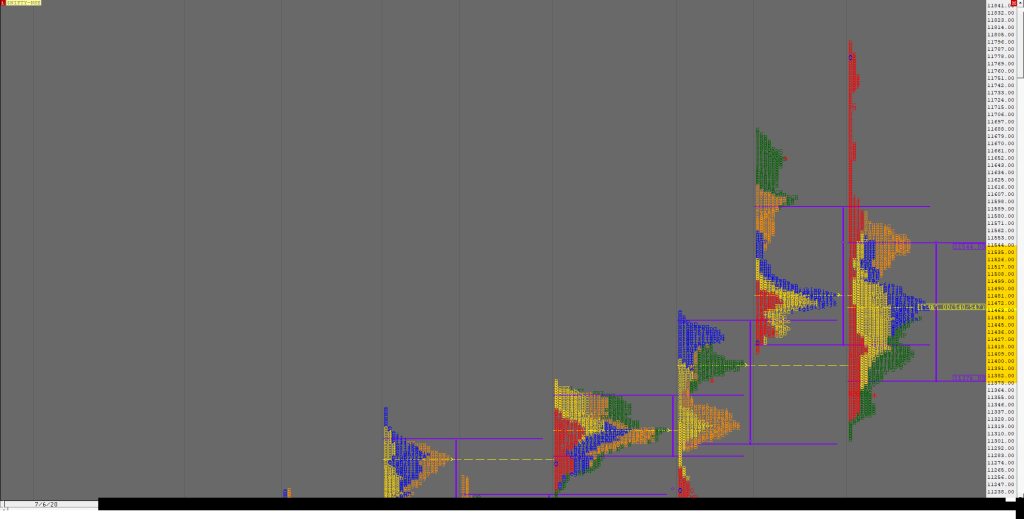
Order Flow charts dated 14th September 2020

Many traders are looking for information on how to use market conditions to find good trades. Order Flow is best understood as a way to see existing bias in the markets. Order Flow helps us understand who is in control of the market and who is ‘upside down’ and likely to make exits from that […]
Market Profile Analysis dated 11th September 2020

Nifty Sep F: 11467 [ 11487 / 11415 ] NF opened below previous day’s spike reference of 11444 to 11468 but was rejected as it not only got back into the spike zone but went on to make new highs for the week at 11487 but stalled at the series HVN of 11485. The auction […]
Weekly charts (07th to 11th September 2020) and Market Profile Analysis

Nifty Spot Weekly Profile (07th to 11th Sep 2020) Spot Weekly – 11464 [ 11493 / 11185 ] Previous week’s report ended with this ‘The weekly profile represents a big ‘b’ shape long liquidation one with the stem from 11602 to 11794 which would be the supply zone for the rest of the month and […]
Order Flow charts dated 11th September 2020

Many traders are used to viewing volume as a histogram beneath a price chart. But the Order Flow approach shows the amount of volume traded during each price bar, and also it breaks this volume down into the Volume generated by the Buyers and the Volume generated by the sellers again at every row of […]
Market Profile Analysis dated 10th September 2020

Nifty Sep F: 11455 [ 11468 / 11331 ] NF not only opened above the Neutral Extreme reference but also negated the bearish extension handle of 11332 giving a bullish start to the day but formed a narrow IB range of just 35 points absorbing all the supply that was coming in building volumes at […]
Order Flow charts dated 10th September 2020

When we think about how to measure volume in the market one of the keys is Order Flow. It plays a role by telling us what the other traders have done in the market and are currently doing and this provides valuable clues and potential opportunities to trade. An Order Flow trader can actually see […]
Order Flow charts dated 10th September 2020 (5 mins)

An Order Flow trader can actually see exactly what is happening in the market as it happens. Once you are able to understand what is happening in the present, you are able to make far better decisions about what might happen in the future. Order Flow provides traders with vision into market activity. NF BNF
Market Profile Analysis dated 09th September 2020

Nifty Sep F: 11307 [ 11324 / 11202 ] NF opened with a big gap down of 75 points below the VPOC of 11250 of 17th Aug and even made a low of 11215 in the opening minute completing a century from the previous close and settled down into an OAOR as it gave a […]
Order Flow charts dated 09th September 2020 (5 mins)

Order Flow is the most transparent way to trade and takes away the guesswork from decision making. NF BNF
Order Flow charts dated 09th September 2020

Timing is the key to successfully trade the markets in the shorter time frame. Order Flow is one of the most effective methods to time your trades by seeing exactly what the other traders are trading in the market and positioning your bias accordingly. Order Flow is the most transparent way to trade and takes […]
