Nifty Spot Weekly Profile (10th to 14th Feb 2020)
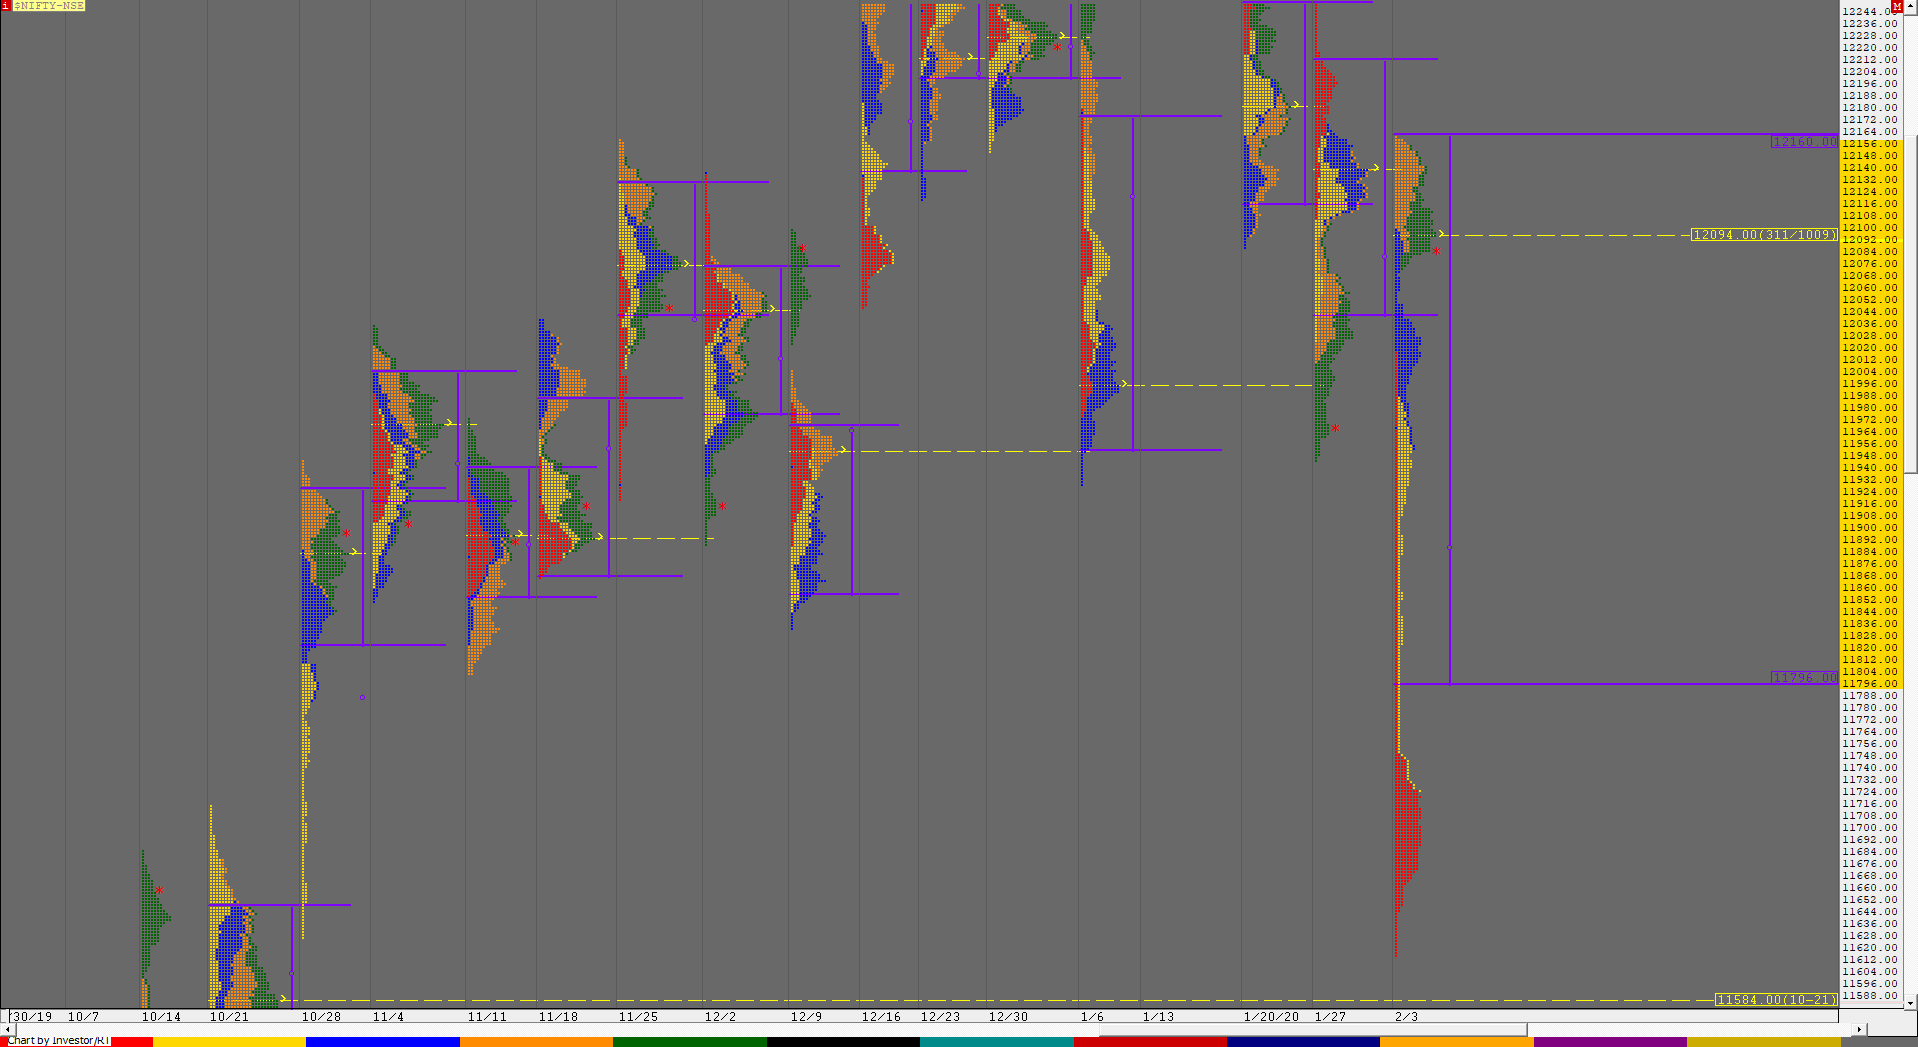
Spot Weekly 12113 [ 12247/ 11991 ]
Nifty gave a Neutral Centre type of profile on the weekly as it first made an attempt to probe lower on Monday with an OTD (Open Test Drive) down start as it seemed to move away from previous week’s POC of 12094 but could not extend the range by much after making that dreaded ‘C’ side extension where it took support at the important level of 11990 and ended up making a ‘b’ shape profile for the day which indicated that the sellers did a bad job. The auction opened with a big gap up the next day and stayed above the weekly POC of 12094 as it made highs of 12172 in the IB (Initial Balance) getting stalled near the weekly VAH of 12160 and for the second day did not make any meaningful RE (Range Extension) on either side though it made a very late attempt to spike lower resulting in a new low for the day of 12099 into the close. Nifty opened with yet another gap up on Wednesday followed by a Drive higher as it scaled above PDH (Previous Day High) thus confirming a multi-day FA (Failed Auction) at 12099 went on to tag the VPOCs of 12194 & 12231 apart from that FA of 12217 it had not tagged since 27th Jan falling just short of the 1 ATR objective of 12233 but the highlight of the day was the fact that once again there was no RE post the C period which meant the market did not get any new buying as it formed a ‘p’ shape profile for the day confirming that it was just the old business (shorts) which were made to cover. The auction opened slightly higher on Thursday but could not get above the PDH and left a selling tail in the IB after which it made a slow OTF (One Time Frame) move lower for the first half of the day and even made an attempt to break below PDL (Previous Day Low) but once again there was no meaningful RE for the 4th consecutive day as it ended up forming a ‘b’ shape profile. Nifty continued the trend of opening higher as it gave a 9th consecutive plus open of this month which seemed to have caught the previous day’s weak or late shorts by surprise leading to a quick move to the upside which saw new highs being tagged for the week at 12247 in the A period but along with it also left the narrowest IB range of this week at just 57 points as the ‘B’ period made an inside bar leaving a small tail at top from 12230 to 12247. The ‘C’ period then made another narrow range bar but what followed in the ‘D’ period was the initiative activity which was missing all this week as Nifty made a RE to the downside almost making a 100 point extension as it made lows of 12098 tagging the earlier multi-day FA of 12099 and completing the 1 ATR target from IBH which was a good objective in this range bound week. The auction then remained in this 100 point range of D period forming a balance for the rest of the day before making marginal new lows for the day at 12091 in the ‘L’ period as it closed the day & week at 12113 with the Friday’s range engulfing the previous 3 days range forming a nice 4-day balance with the POC at 12157 which would level to cross for more upside. The weekly Value is at 12096-12148-12208 which is overlapping to higher compared to the previous week and has 3 distributions with singles of 12091 to 12031 separating the mid & the lowest distribution and would be the immediate reference in the coming week if Nifty stays below 12096. On the upside, staying above 12096 could get the 80% Rule into play in the nice distribution from 12096 to 12172 which has a prominent POC at 12148.
Click here to view the MPLite chart of this week’s auction in Nifty
Weekly Hypos for Nifty (Spot):
A) Nifty needs to sustain above 12103 for a move to 12148-157 / 12192-211 & 12250-266
B) Acceptance below 12090 could lead the auction to test 12045-031 / 12008*-11990 & 11965
C) Above 12266, Nifty can probe higher to 12295* / 12322-331 & 12376-400
D) Below 11965, lower levels of 11936 / 11896-881 & 11857-830 could come into play
NF (Weekly Profile)
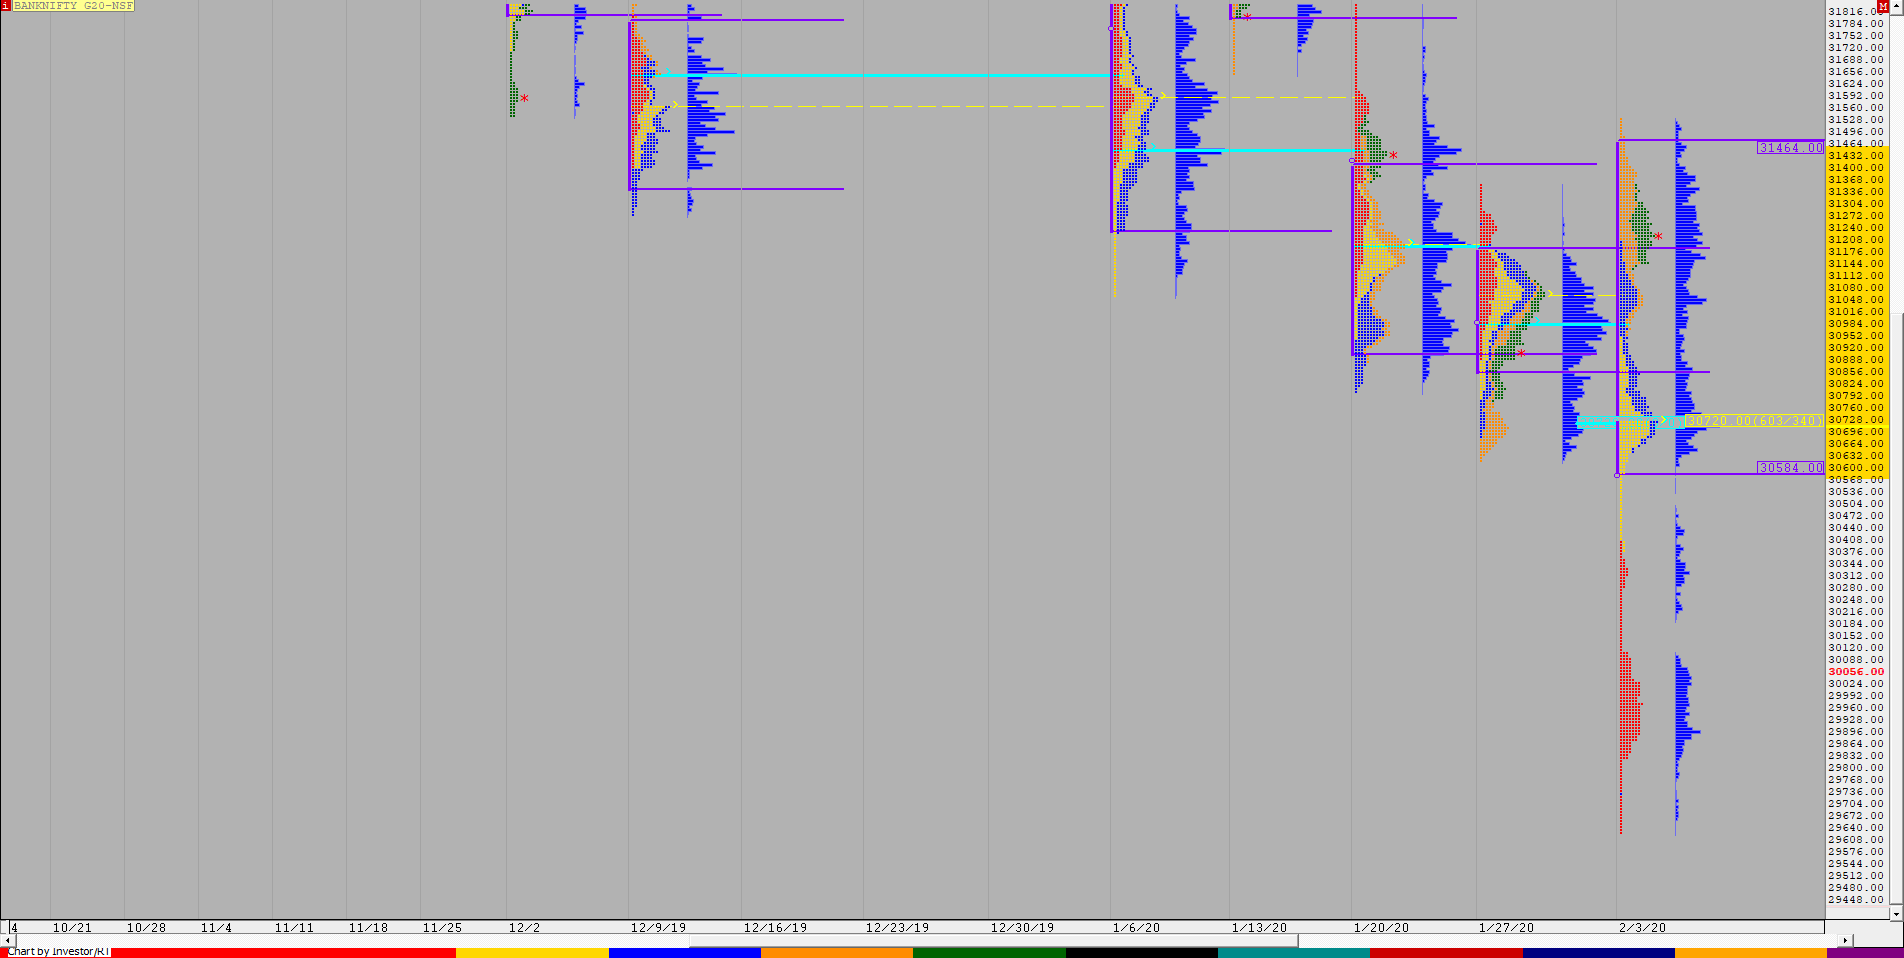
12129 [ 12260 / 11985 ]
NF once again has made a Triple Distribution profile on the weekly with Value at 12117-12162-12225 with a very prominent POC at 12162 which could act as a magnet if the auction does not move away from this week’s Value with some initiative volumes in the coming week. NF has the HVN of the top most distribution at 12220 and that of the lowest distribution at 12012.
BankNifty Spot Weekly Profile (10th to 14th Feb 2020)
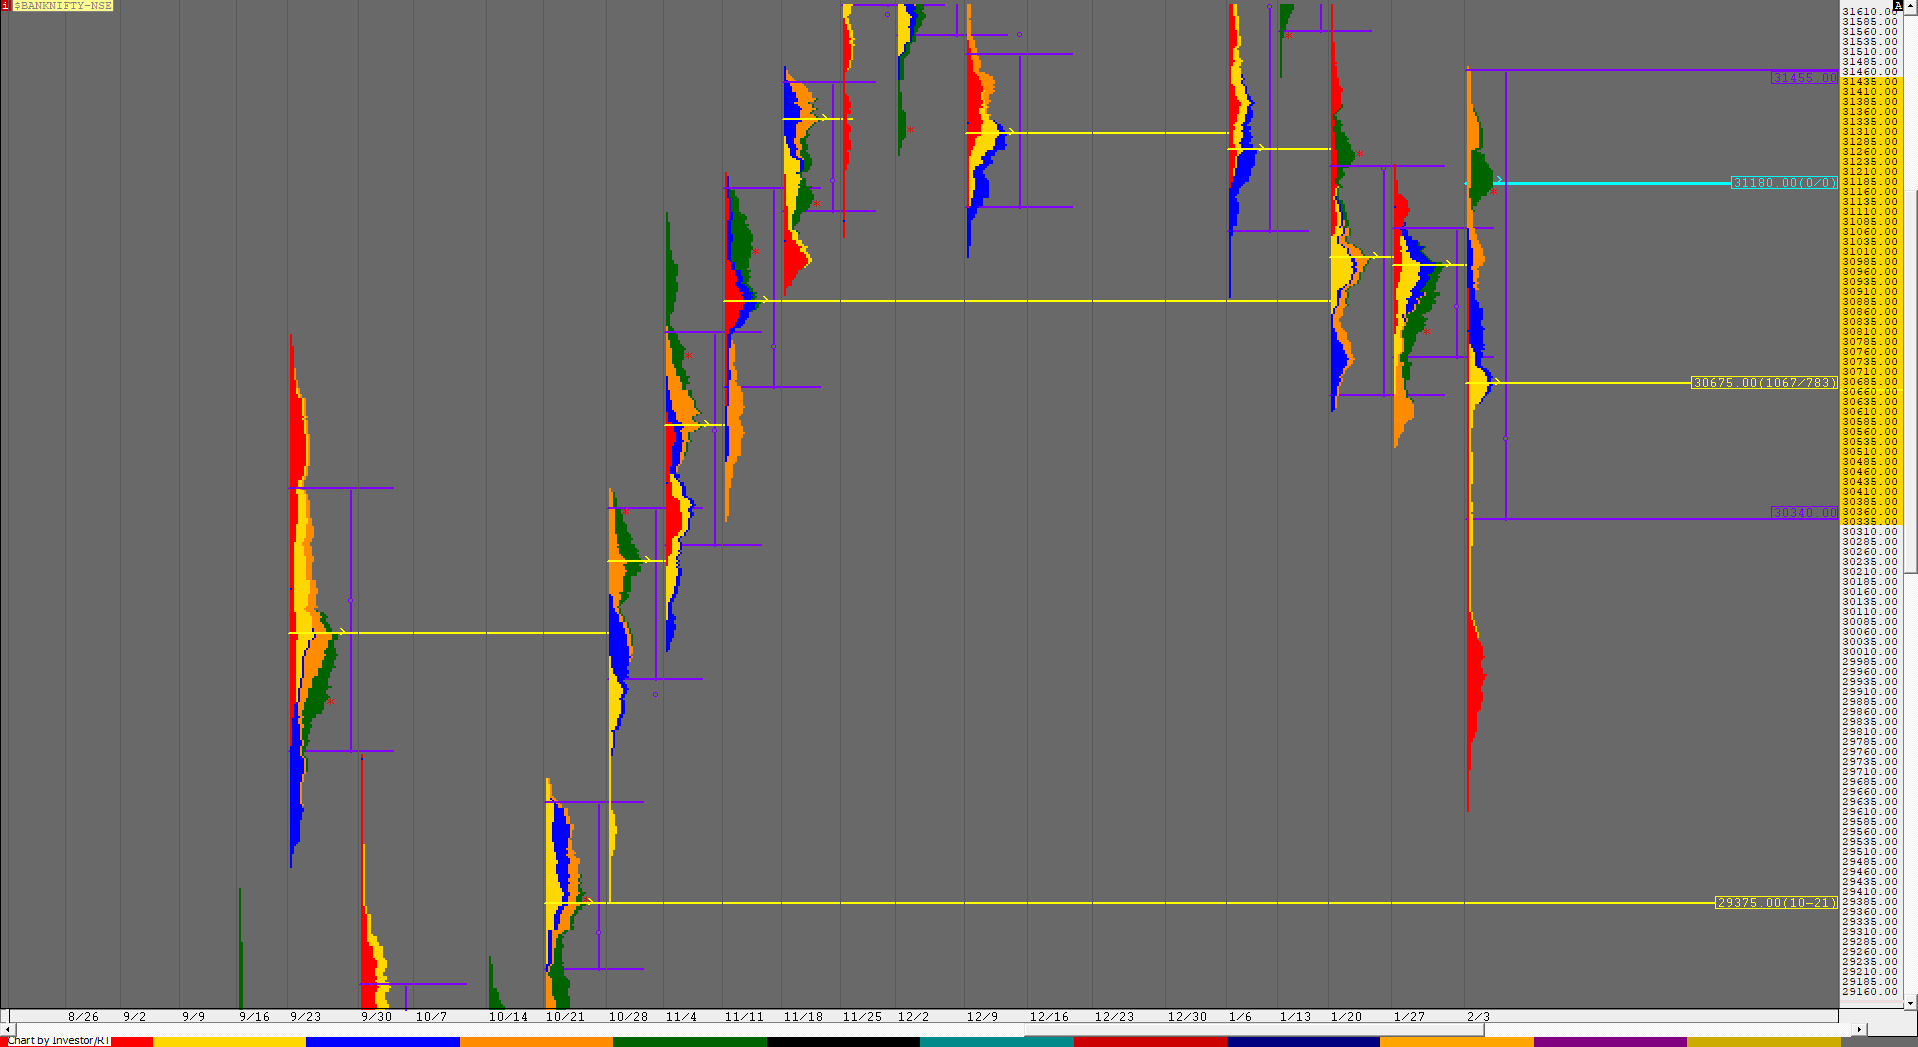
Spot Weekly 30835 [ 31649 / 30776 ]
BankNifty made a freak OH (Open=High) start to the week at 31248 whereas the actual auction was below the HVN of 31180 as the first probe of the week was to the downside which was stalled by a C side extension after making lows of 30957 resulting in a ‘b’ shape profile on Monday with a close around the prominent POC of 31067. BankNifty gave a big gap up open the next day above the 31180 level which was almost an OL (Open=Low) start too at 31230 which meant that the PLR (Path of Least Resistance) had now turned to the upside as the auction probed higher scaling above previous week’s VAH as it tagged 31506 in the IB but could not extend any further and stayed within this IB range all day leaving a rare Normal Day with higher Value on the daily. Wednesday saw another higher opening in BankNifty where it took support at previous day’s VAH and went on to make new highs for the week at 31555 in the IB and even made an attempt to probe higher as it made new highs of 31589 in the C period but was rejected back into the IB as it formed another Normal Day with a balanced profile and higher Value which meant that the PLR remained to the upside. The auction then opened with yet another gap up on Thursday which was the 8th day in succession it was doing so as it scaled above PDH and made new highs for the week at 31649 but got rejected in a very swift manner as it not only got back into the previous day’s range negating the gap up but went on to break below previous day’s low and in the process confirmed a multi-day FA (Failed Auction) at 31649 along with an ORR (Open Rejection Reverse) which meant that big players have entered and all this happened in the ‘A’ period itself. BankNifty then left a huge selling tail in the IB from 31381 to 31649 and trended lower all day as it completed the 1 ATR objective of 31213 and took support right at that HVN of 31180 before it closed the day at 31230 leaving a ‘b’ shape profile for the day. BankNifty extended the record of opening higher to the 9th day on Friday as it began with an almost OL start of 31281-31273 which led to a drive higher probably forcing the late shorts of previous day to exit as the auction got into the previous day’s selling tail of 31381 to 31649 while making a high of 31436 in the ‘A’ period but was once again rejection from this zone as it left yet another selling tail in the IB from 31376 to 31436 which re-confirmed the fact that big players had entered shorts on Thursday and were aggressively defending their zone here. The ‘C’ period passed off as a quiet one inside the IB within just a 60 point range but that turned out to be the silence before the storm as the ‘D’ period made a huge RE to the downside as it left an extension handle at 31260 and fell by almost 500 points in those 30 minutes to complete the 2 ATR objective of 30777 from the FA of 31649 to the dot as it made lows of 30776. This big imbalance coupled with the completion of a big objective then led to a balance being formed for the rest of the day in the lower half of the D period as the day ended as a DD (Double Distribution) Trend Day with the DD singles being from 31095 to 31260. The weekly Value is overlapping to higher at 31055-31319-31585 but the profile looks like a Triple Distribution Trend down which was also a Neutral Extreme with a close at 30835 which is well below the Value so the PLR for the coming week would be towards that weekly VPOC of 30675 below which there is a big low volume zone from 30574 to 30105.
Click here to view the BankNifty action this week with respect to the previous week’s Value on MPLite
Weekly Hypos for Bank Nifty (Spot):
A) BankNifty needs to stay above 30835 for a probe to 30880-900 / 30954-977 / 31055-065 & 31155-180
B) Immediate support is in the zone of 30801-791 below which the auction could test 30726-675 / 30625 / 30574-538 & 30451-431
C) Above 31180, BankNifty can probe higher to 31241-261 / 31319-330 / 31377 & 31425-436
D) Below 30431, lower levels of 30381-364 / 30275 & 30190 could come into play
E) If 31436 is taken out, BankNifty could rise to 31507-517 / 31585-596 / 31649-685 & 31740-774
F) Break of 30190 could trigger a move lower to 30102 / 30021 / 29950-930 & 29881*
BNF (Weekly Profile)
30902 [ 31627 / 30774 ]
BNF has made a Neutral Extreme profile on the weekly with Value at 30856-31080-31408 with a HVN at 31560 which seems to be the level where initiative shorts have entered. The Neutral Extreme reference for the coming week would be from 31004 to 30774 and till the auction does not get above this, the PLR remains to the downside.


