Nifty Spot Weekly Profile (14th To 18th October)
Spot Weekly 11662 [ 11685 / 11290 ]
Previous week’s report ended with this ‘…the auction will need to get above 11325-340 for a move towards 11432-450 & 11574’
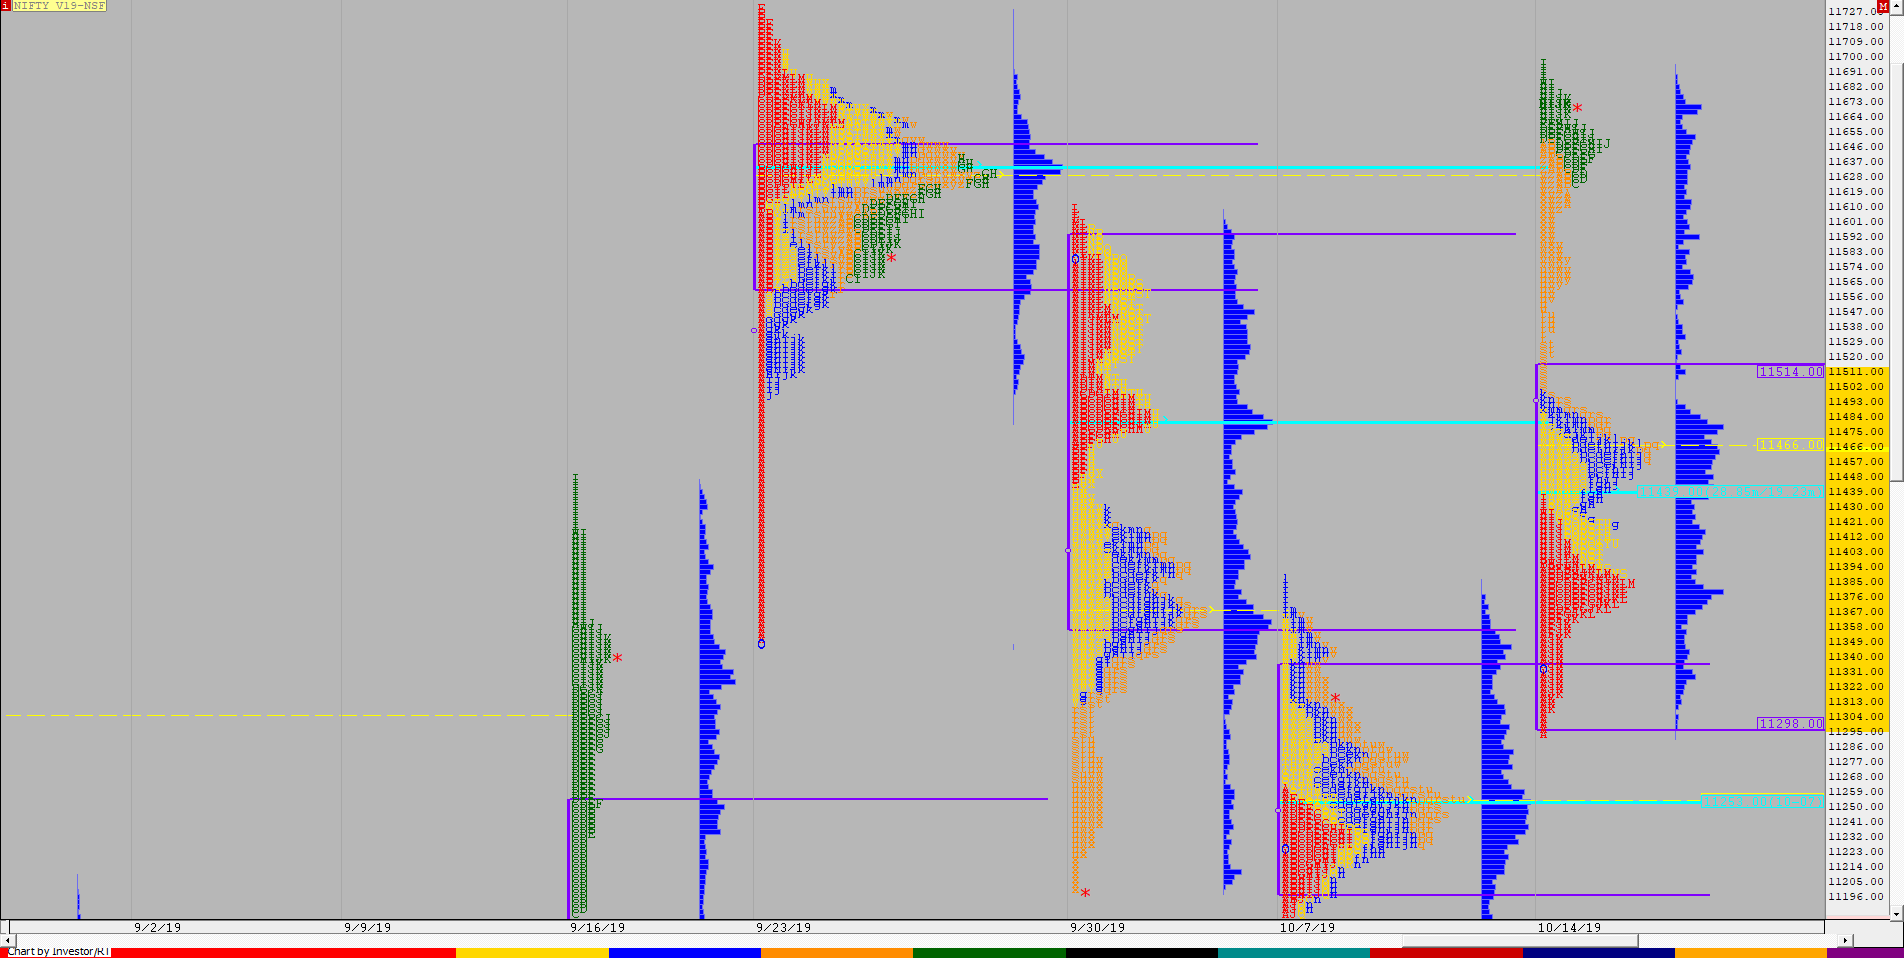
Nifty gave an OAIR (Open Auction in Range) start on Monday on the daily time frame but on the weekly it was an ORR (Open Rejection Reverse) as it tested previous week’s Value at open and was rejected from there leaving a small tail from 11313 to 11290 which set up a trending week as the auction made higher highs & higher lows on all 5 days this week with a close around the highs leaving an elongated weekly profile with an extension handle at 11480 and a low volume zone between 11480 to 11610 which acted an an expressway because it was the Value Area of the weekly Gaussian profile (23rd Sep to 27th Sep – read that week’s report here) and stalled just below that week’s swing high of 11695 as it tagged 11685 on Friday. The first part of the week was forming a large balance between 11368 to 11476 but the confirmation of a multi-day FA (Failed Auction) at 11411 post IB (Initial Balance) on Thursday led to an initiative move higher as Nifty doubled the week’s range from 195 points to 395 points falling just short of the 2 ATR objective from the FA which was at 11711. This week’s Value is at 11312-11458-11496 which is way below the close of 11662 but the auction has formed a small distribution at the higher zone of 11620 to 11670 which will be the immediate reference for the next week.
Weekly Hypos for Nifty (Spot):
A) Nifty needs to sustain above 11665 for a move to 11711-719 / 11766-773 & 11811-828
B) Immediate support is at 11620-611 below which the auction could test 11565-557 / 11506-480 & 11455
C) Above 11828, Nifty can probe higher to *11862*-882 / 11912-937 & 11976-991
D) Below 11455, lower levels of 11427 / 11395-385 / 11345 & 11310-290 could come into play
E) If 11991 is taken out & sustained, Nifty can have a fresh leg up to 12018-25 / 12042-46 & 12070-77
F) Break of 11290 could bring lower levels of 11250-230 / 11184-180 & 11142-127
NF (Weekly Profile)
11670 [11695 / 11293]
NF opened with a small gap up on Monday which was closed immediately but there was swift rejection from 11293 as the auction left a small buying tail at lows to get back above previous week’s Value and probed higher and went on to make a RE on the upside getting above the previous week’s high as it made highs of 11433 but saw a big liquidation break in the last 45 minutes as it gave up all the gains to close back around the open price at 11336. The auction opened higher on Tuesday confirming that the previous day’s closing move was more emotional caused by the locals getting too long and now that the inventory was reset, the main probe had resumed as NF made a slow OTF (One Time Frame) move higher all through the day scaling above PDH to make new highs of 11473. NF opened higher yet again on Wednesday making new highs of 11485 in the ‘A’ period but remained in the narrow IB range of just 58 points for most part of the day and the attempt to probe lower in the ‘I’ period was met with rejection as the auction got back to close the day around the highs leaving a narrow range Gaussian profile which indicated that a good range expansion could come in the next session. More confirmation of this came at open on Thursday as NF scaled above PDH to make new weekly highs of 11496 to confirm a multi-day FA at 11420 but the auction was stuck in one of the narrowest IB range of just 33 points till the ‘F’ period which saw an attempt to make a RE lower but just like the previous day was swiftly rejected at 11458 and this failure to find sellers below the IBL empowered the buyers to take control as the auction trended higher for the rest of the day confirming another FA at day’s low and completed the 1 ATR objective of 11611 from 11458 leaving a Neutral Extreme profile for the day. Friday open was below the Neutral Extreme reference of 11580 to 11619 but NF took support at 11551 as it left a buying tail in the IB till 11609 to indicate that the buyers were still in control as it continued the trend to make higher highs on all days this week tagging 11639 in the ‘B’ period and in the process left a large IB range of 88 points. NF then made a slow OTF higher making multiple REs up but formed a balanced ‘p’ shape profile for the day as it hit 11695 in the ‘K’ period building volumes at 11670 where it eventually closed to leave an elongated profile for the week with Value at 11298-11466-11514.
BankNifty Spot Weekly Profile (14th To 18th October)
29120 [ 29249 / 28043 ]
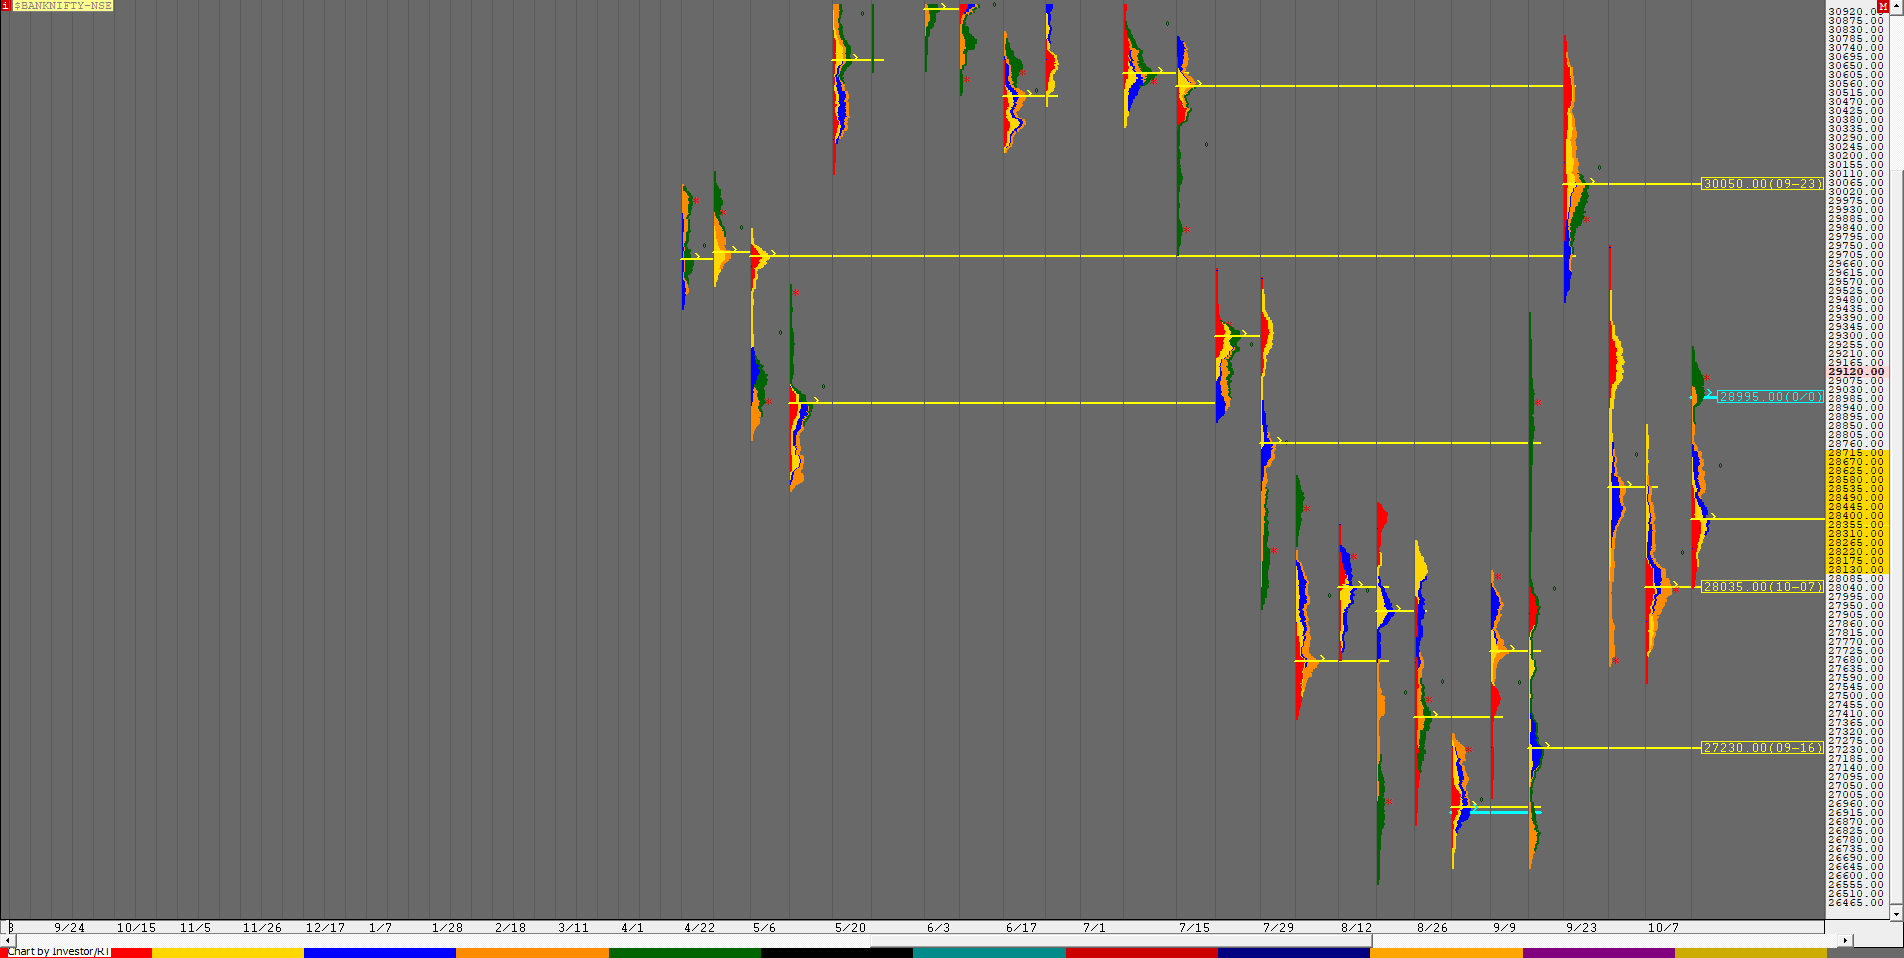
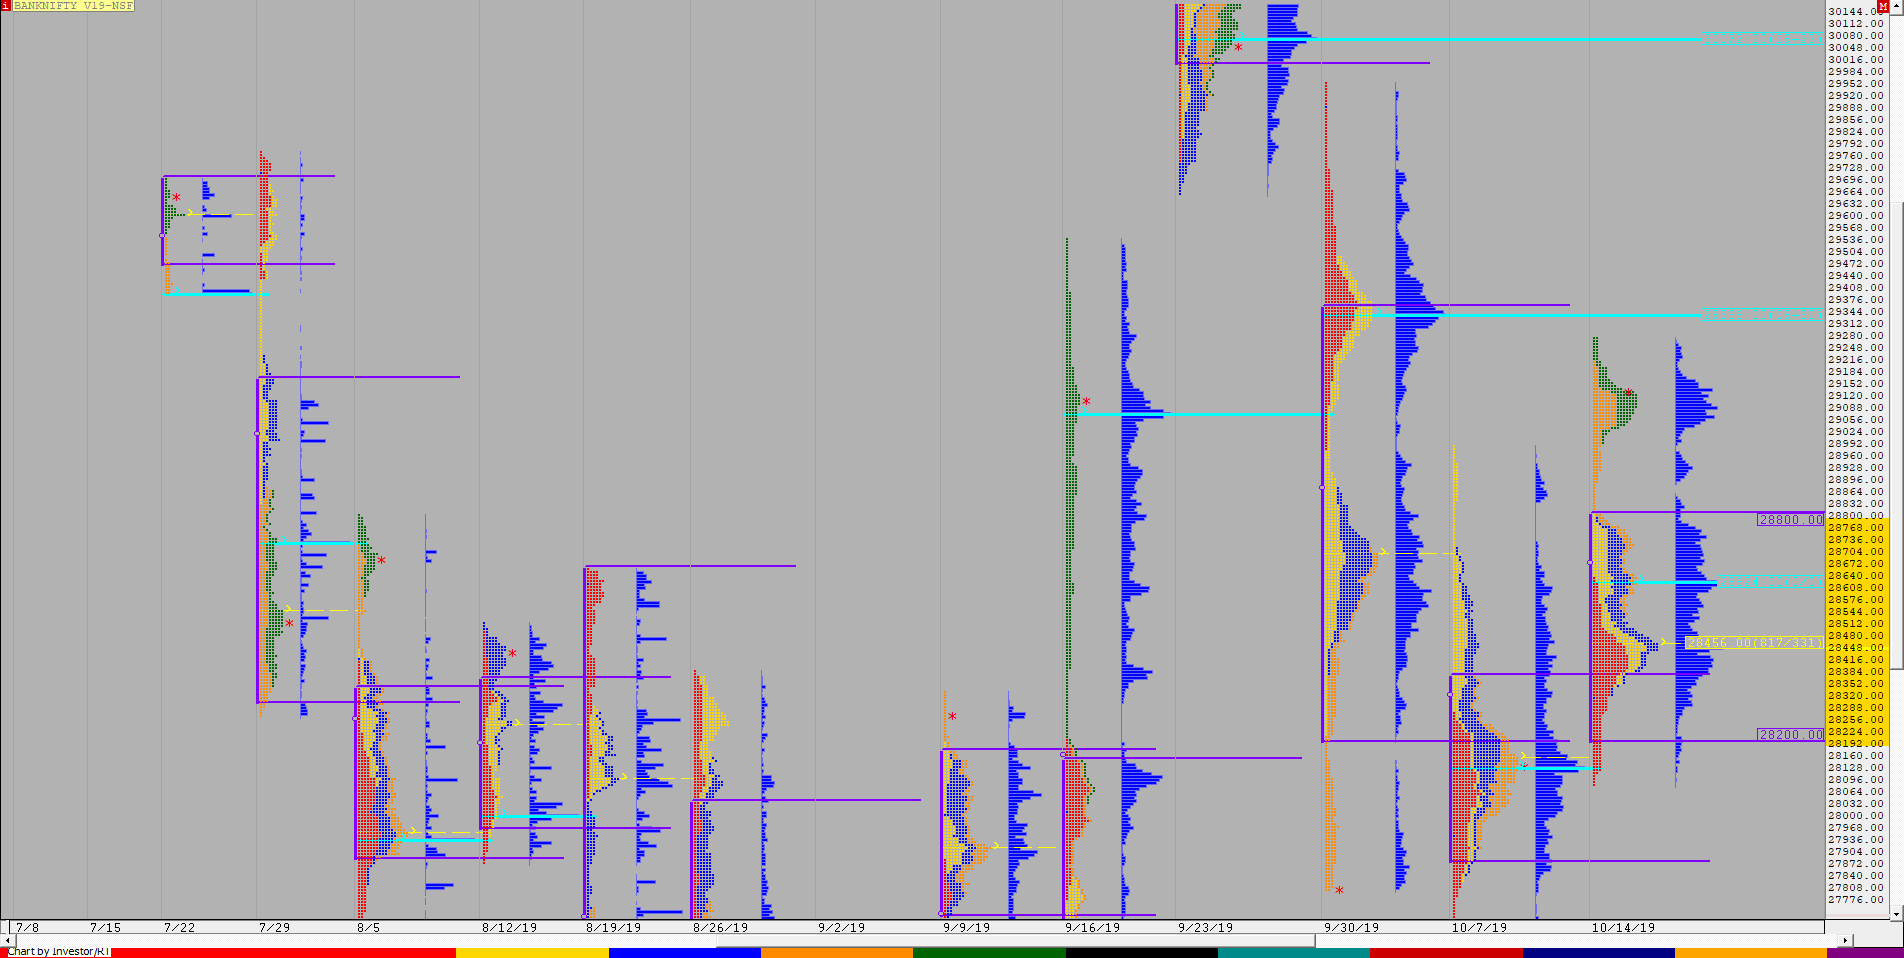
BankNifty had left a prominent weekly POC at 28035 (mentioned in previous week’s report) & this week it took support not once but twice just above it on Monday as it made lows of 28043 & 28050 in the first & last TPO suggesting that the downside for the week was limited. The auction then left a small buying tail at open on Tuesday moving away from the weekly VAH of 28205 which confirmed that the PLR (Path of Least Resistance) is to the upside as it made made new highs for the week at 28695 but left a selling tail on daily from 28616 to 28695. BankNifty then opened with a gap up on Wednesday negating this tail and made new highs of 28759 in the ‘A’ period but could not extend higher making a similar high of 28750 in the ‘D’ period indicating short term exhaustion which led to a RE (range extension) lower as it gave a pull back to 28305 in the afternoon but left a small tail at lows suggesting end of the downside probe. Thursday saw the auction give an OAIR (Open Auction In Range) start and it remained in a very narrow range of 187 points for first couple of hours which was also the narrowest IB range from over a month and this indicated that a big move was in the making. BankNifty then made an attempt to make a RE lower but was swiftly rejected and this rejection on the downside triggered a trending move in the opposite direction as a FA was confirmed at 28488 above which the auction left an extension handle at 28759 and scaled above the Oct 9th swing high of 28858 and made highs of 29049. There was an attempt to probe lower at Friday open but BankNifty took support at 28864 displaying change of polarity as it reversed the probe to upside scaling above PDH while making new highs for the week at 29165 in the IB and the auction remained in this range for most of the day before giving multiple REs to the upside in the ‘J’ & ‘K’ periods to tag 29249 almost completing the 1 ATR objective of 29253 from the daily FA of 28488 and closed the day at 29120 leaving the narrowest daily range of just 385 points from over a month giving good chance that the next session could be a big one . The weekly profile is an elongated Double Distribution one with a big lower distribution with the HVN at 28361 and a small upper distribution with Value at 28997-29102-29151 and the low volume zone from 28760 to 28945 separating the 2 distributions. The weekly Value was mostly higher at 28130-28361-28715 with a HVN at 28995 which will be the immediate reference on the downside in the coming week.
Weekly Hypos for Bank Nifty (Spot):
A) BankNifty needs to sustain above 29155 for a move to 29242-253 / 29325-351 / 29411-415 & 29500-525
B) Immediate support is at 29071-50 below which the auction could test 28986-950 / 28900-864 / 28815-810 & 28766-757
C) Above 29525, BankNifty can probe higher to 29585-600 / 29671 / 29755-762 & 29850-874*
D) Below 28757, lower levels of 28715 / 28640-625 / 28560 & 28488-477 could come into play
E) If 29874 is taken out, BankNifty could rise to 29930 / *30016-50* / 30105-113 & 30170-190
F) Break of 28477 could trigger a move lower to 28413 / *28363-360* / 28305-280 & 28225-205
G) Sustaining above 30190, the auction can tag higher levels of 30230-277 / 30364-388 / 30451 & 30538-570
H) Staying below 28205, BankNifty can probe down to 28140-130 / *28057-35* / 27975-940 & 27890
BNF (Weekly Profile)
29152 [ 29300 / 28083 ]
BNF stayed inside previous week’s range for the first 3 days this week forming a balance between 28083 and 28807 but the confirmation of a weekly FA at 28083 set up the auction for a probe to the upside which happened on Thursday as BNF scaled above the previous week’s high to give a move away from not just this week’s 3-day balance but from a larger 9-Day composite as it left a weekly extension handle at 28807 and a daily one at 28870 after which it went on to tag 29150 and closed around the HVN of 29070. The auction opened with a gap down on Friday and continued to probe lower as it took support just above the extension handle of 28870 while making a low of 28903 as it left singles in the IB and resumed the main probe of the week to the upside to make new highs of 29300 but saw some profit booking at highs as it left a 3-1-3 profile on the daily building volumes at 29140 where it eventually closed. The weekly profile looks like a Double Distribution Trend Up profile with Value at 28200-28624-28800 which formed the lower distribution and has 2 important HVN references in the upper part at 29140 & 29070 which would be the immediate support levels below which low volume zone of 28980 to 28807 could come into play. On the upside, BNF has the weekly VPOC of 29336 and the 1 ATR objective of 29440 from the weekly FA of 28083 as immediate targets.


