Nifty Spot Weekly Profile (6th to 10th Jan 2020)
Spot Weekly 12257 [ 12311/ 11929 ]
Previous week’s report ended with this ‘Range wise Nifty stayed in one of the narrowest weekly range of just 138 points which was last seen in Jan 2019 and was almost an inside bar with the weekly Value also overlapping the previous 2 week’s Value which sets up for a good move in the coming week(s). The weekly Value is at 12200-12226-12268 & the 3 week composite has Value at 12189-12265-12283‘
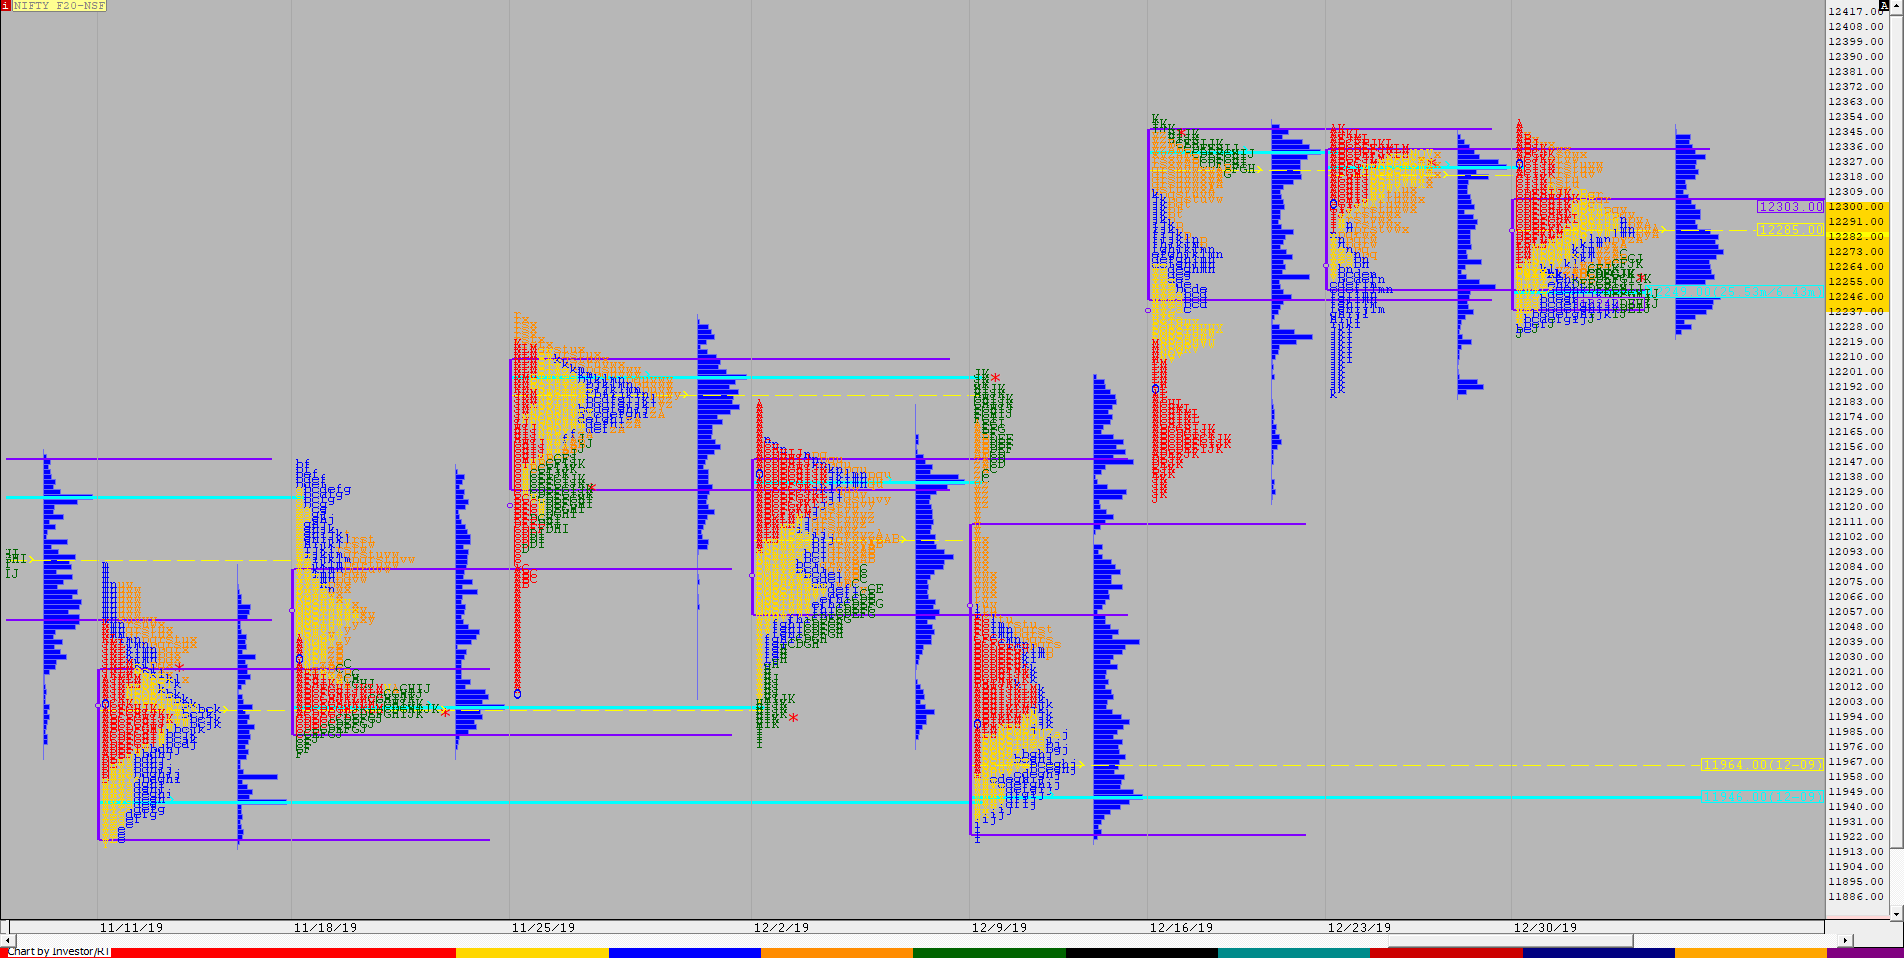
Nifty began this week with a gap down of 50 points plus an Open Drive Down and as expected gave a big move away from the 3-week composite from just below the composite VAL of 12189 as it made a high of 12179 and fell by more 200 points as it made lows of 11974 on Monday. This imbalance led to a balance being formed on Tuesday with the auction staying inside the previous day’s range forming a nice 2 day Bell Curve. Imbalance returned on Wednesday in the form of a huge gap down of 110 points as Nifty opened in the buying tail of 11905 to 11939 (spike close of 11th Dec & the gap up open on 12th which started the new IPM [Initial Price Movement]) and took support at 11929 leaving another buying tail after which it went on to close the gap making a high of 12045 leaving one of the largest IB (Initial Balance) range of 115 points and auction remained in this range all day forming a nice balanced profile for the day. The tail at lows & the overlapping Value on daily hinted that the trade facilitation on the downside was getting poorer and the gap up of more than 125 points on Thursday when Nifty opened at 12153 confirmed that the PLR (Path of Least Resistance) has now changed to the upside. The auction continued to probe higher and made new highs for the week as it got back into the 3-week composite Value of 12189-12265-12283 and completed the 80% Rule on Friday as it opened with yet another gap up and took support above PDH as it made lows of 12231 after which it continued the probe higher making multiple REs on the upside for the first part of the day as it not only scaled above previous week’s high but also made new All Time Highs getting above the 12300 level for the first time to hit 12311 but the second half of the day saw some big profit booking as the auction reversed the probe to the downside making a OTF (One Time Frame) move lower and even went on to make a RE to the downside making lows of 12213 before closing at the dPOC of 12257 leaving a Neutral Day at all time highs though the weekly profile is that of a Neutral Extreme. Nifty has made an outside bar this week with the Value at 11955-11994-12172 and could consolidate in the Neutral Extreme reference of 12179 to 12311 in the coming session(s) before giving a move away with the PLR for now being to the upside.
Click here to view the Nifty action this week with respect to the 3-week composite on MPLite
Weekly Hypos for Nifty (Spot):
A) Nifty needs to sustain above 12266 for a move to 12310-321 / 12347-377 & 12403-433
B) Immediate support is at 12231-211 below which the auction could test 12192*-172 / 12136 & 12100
C) Above 12433, Nifty can probe higher to 12458-485 / 12517-524 & 12545
D) Below 12100, lower levels of 12045 / 11994* & 11955-936 could come into play
E) If 12545 is taken out, Nifty can have a fresh leg up to 12576 / 12601 & 12657
F) Break of 11936 could bring lower levels of 11910-881 & 11856-836
NF (Weekly Profile)
12290 [12357 / 11976]
NF did give a range expansion from previous week’s narrow range of just 125 points to give a 380 point range this week as it opened the week with an initiative move lower with an Open Drive Down on Monday resulting in a Trend Day as it made lows of 12025. This big imbalance then led to a balance being formed on Tuesday as the auction stayed within the previous day’s range & Value. Wednesday then saw a big gap down opening as NF made lows of 11976 in the IB but could not make an RE to the downside as it remained in the IB all day forming a balance which indicating poor trade facilitation at these new short term lows. NF then made a similar gap on Thursday but this time it was to the upside as it got back into the 3-week composite Value of 12234-12252-12315 which led to further short covering resulting in a Double Distribution Trend Day higher and this leg up continued on Friday in the form of another gap up as the auction completed the 80% Rule on the composite Value and went on to record new all time highs of 12357 but saw some good profit booking as NF ended the week with a Neutral Day to close at 12290. The weekly Value is lower at 11911-12057-12210 but the close once again has been in the composite range.
BankNifty Spot Weekly Profile (6th to 10th Jan 2020)
32097 [ 32347 / 30899 ]
Previous week’s report ended with this ‘BankNifty closed the week at 32069 leaving an outside bar with an excess in the form of an FA at all time highs with overlapping to lower Value at 32080-32280-32330 but the PLR (Path of Least Resistance) seems to be down as the close has been below the VAL for the first time in 4 weeks with 32100 being the immediate reference on the upside as the 3 week composite Value in BankNifty stands at 32098-32366-32393‘
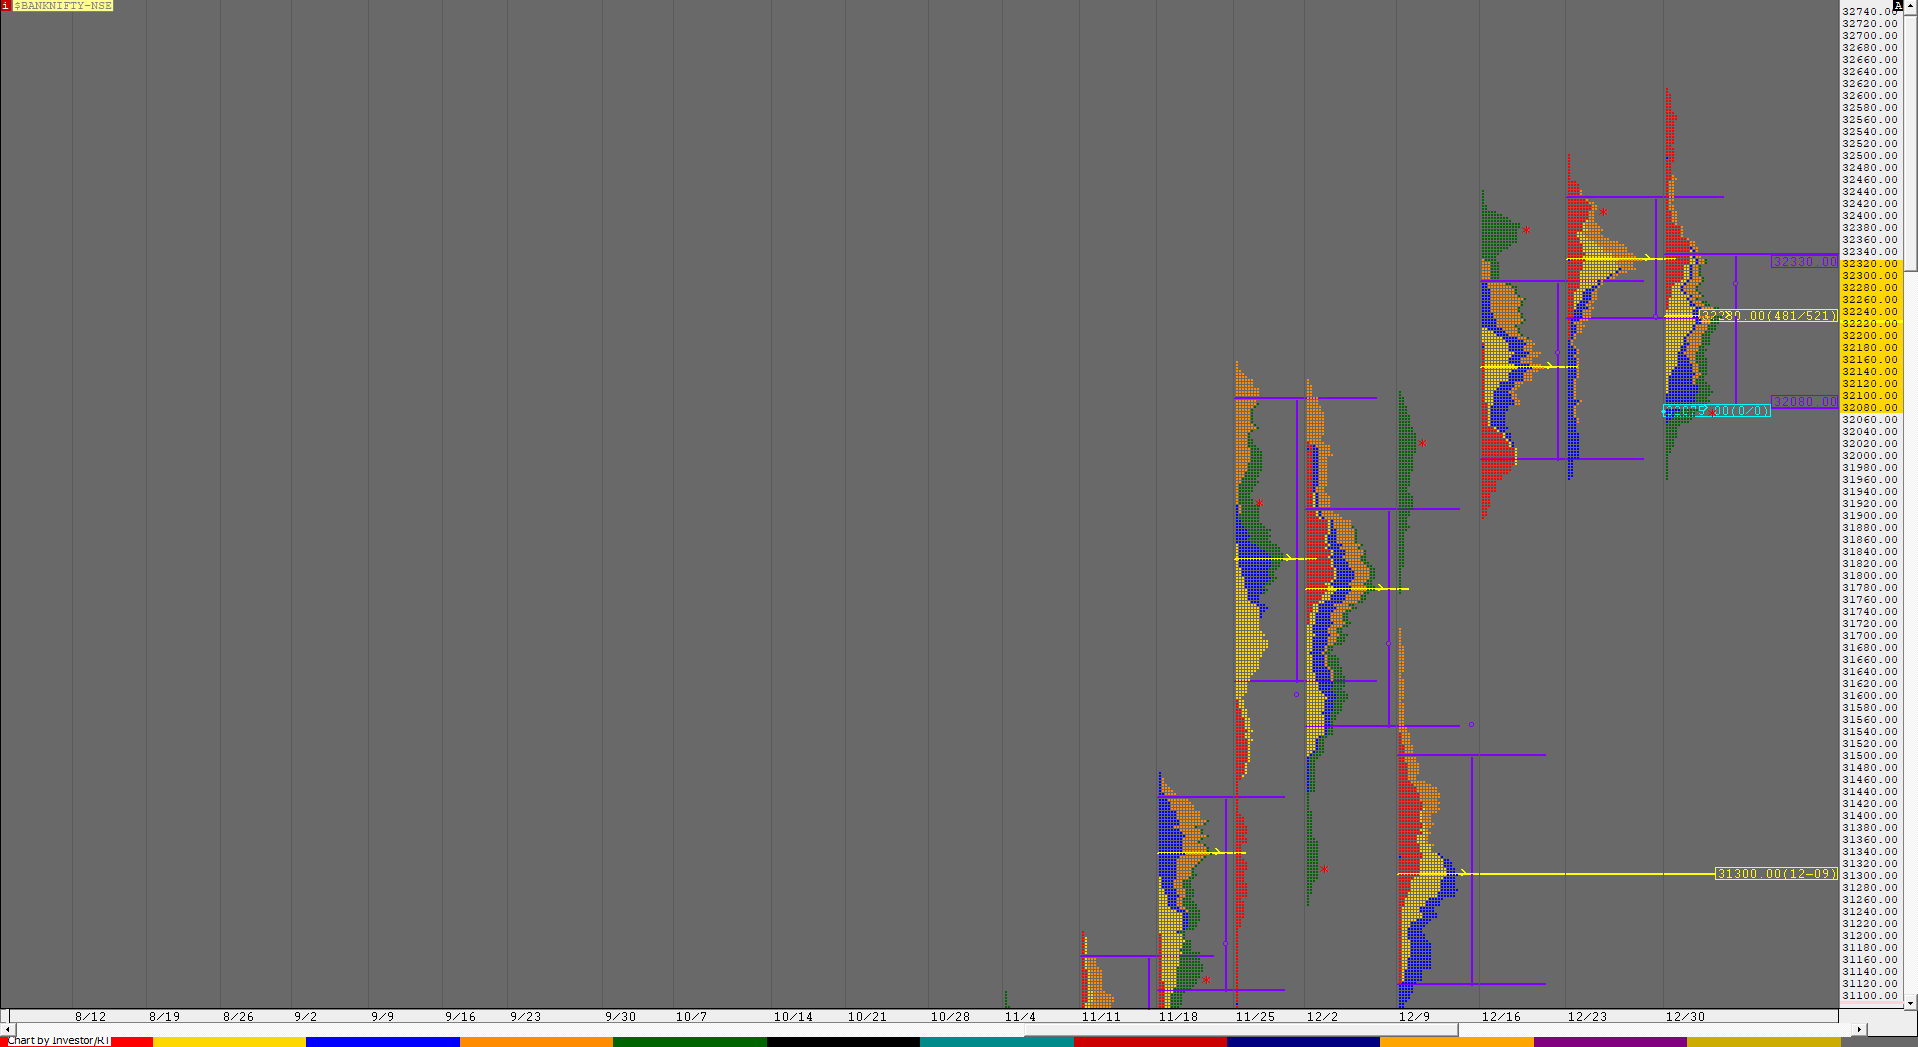
BankNifty made a gap down open this week with an almost OH start at 31910-31914 and continued to drive lower on Monday giving an initiative move away from the 3-week composite as it made big fall of 744 points while marking lows of 31170 which looked a bit stretched therefore leading to a balance on Tuesday as the auction made an inside bar with overlapping Value. Imbalance returned back on Wednesday open as BankNifty gapped lower by more than 400 points and went on to break below the weekly HVN & buying tail of 30996 as it made lows of 30899 but was swiftly rejected as it left a fresh buying tail on the daily time frame from 31050 to 30899 and made a ‘p’ shape profile for most of the day before giving a spike into the close from 31361 to 31451 leading to a gap up the next day as the buying singles of previous day continued till 31768. The auction continued to probe higher on Thursday making an OTF move till the ‘I’ period as it got back into the composite Value of 32098-32366-32393 and made highs of 32173 after which it made a small balance rotating around the HVN of 32100. Friday saw another gap up open as BankNifty made new highs for the week at 32216 and took support at 32050 before resuming the up move and making multiple REs higher in the first half as it completed the 80% Rule in the previous week’s Value of 32080-32280-32330 but could not tag the POC of that 3-week composite which was at 32366 and this indicated exhaustion leading to a big liquidation move down in the second half of the day as the auction not only retraced the entire move up of the day but went on to make a RE to the downside as it made a low of 31953 stalling just above the weekly OH start of 31914 and gave a bounce back to 32134 before closing the day & week at the overlapping 2 day POC of 32100. The weekly profile is an elongated Neutral Extreme one with a huge 1448 point range with Value at 31060-31260-31950 and the reference for the coming week would be 31915 to 32347.
Weekly Hypos for Bank Nifty (Spot):
A) BankNifty needs to sustain above 32135 for a move to 32221-246 / 32311-321 & 32393-401
B) Staying below 32100, the auction could test 32040 / 31952 & 31885-863
C) Above 32401, BankNifty can probe higher to 32465-490 / 32581-613 & 32670
D) Below 31863, lower levels of 31774-768 / 31685-667 & 31596 could come into play
E) If 32670 is taken out, BankNifty could rise to 32750-762 / 32850 & 32943-955
F) Break of 31596 could trigger a move lower to 31510-487 / 31418 & 31368-330
G) Sustaining above 32955, the auction can tag higher levels of 32396 / 33033-125 & 33190-219
H) Staying below 31330, BankNifty can probe down to 31260-235 / 31152 / 31060-50 & 30990-975
BNF (Weekly Profile)
32123 [ 32385 / 30972 ]
BNF has made an elongated weekly profile with a range of 1413 points as it opened the week with an initiative move away from the 3-week composite and went on to test the weekly VPOCs of 31464 & 31050 where it left a buying tail from 31115-30972 which reversed the probe to the upside as the auction got back into the composite Value and made highs of 32385 stalling just below the composite POC of 32400 on Friday which led to a long liquidation move into the close as BNF closed the week at 32123 giving a Neutral Extreme profile with Value at 31112-31488-31944 and the reference for next week at 32023 to 32385.


