Nifty Spot Weekly Profile (7th to 11th October)
Spot Weekly 11305 [ 11363 / 11090 ]
Previous week’s report ended with this ‘…the PLR for the coming week would be down if the auction breaks below 11152 which was the low of the weekly buying tail below which the next reference would be the extension handle of 11073. On the upside, Nifty will have to scale above 11248-252 for a probable test of 11325 which could act as important resistance in the coming week(s)‘
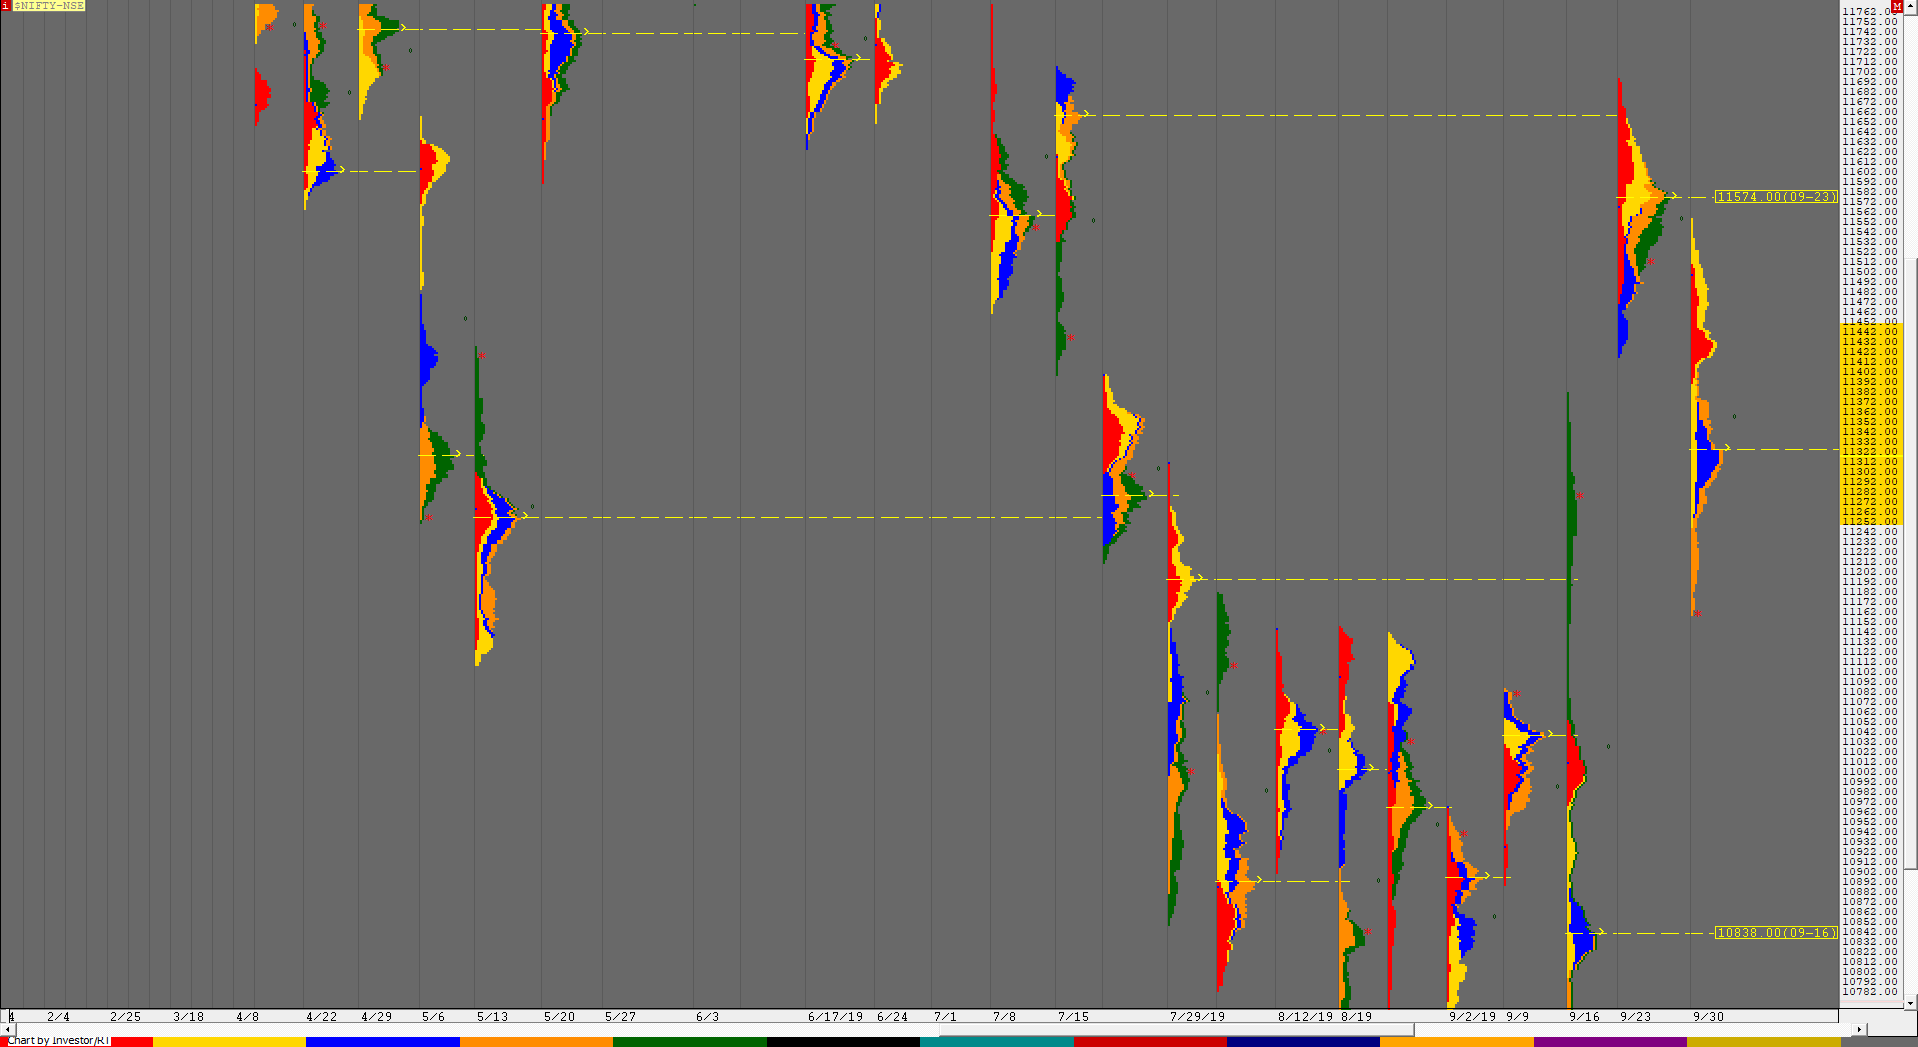
Nifty continued the closing imbalance of the previous week on Monday as it remained below the weekly Value and made a RE (Range Extension) to the downside as it went on to break previous week lows tagging 11112 closing in a spike. The auction made new lows of 11100 on Wednesday (after a holiday on Tuesday) in the IB (Initial Balance) and made an attempt to extend lower as it hit 11090 taking support just above the important reference of 11073 from where it reversed the probe to the upside and went on to confirm a FA (Failed Auction) on both the daily as well as weekly time frame and this led to a trending move higher as Nifty not only got back into the previous week’s range but got accepted in previous Value also as it completed the 1 ATR objective of the daily FA at 11288 and continued higher almost tagging the next important reference of 11325 which was previous week’s POC as it hit made highs of 11322 leaving a Neutral Extreme profile for the day. This move of imbalance then led to a balance being formed on Thursday as Nifty stayed below the Neutral Extreme reference making an inside bar before Friday saw big moves on both sides as the auction opened with a drive up and went on to tag new highs for the week at 11363 in the opening 30 minutes but once it broke below the 11325 level post IB, it gave a big liquidation move getting back into the previous day’s range and continued lower making a RE to the downside to give a quick slide to 11189 where it saw swift rejection as it left a buying tail from lows to 11228. This probe higher got stalled at the monthly VAH of 11340 as Nifty closed at 11305 leaving a well balanced weekly profile with a prominent POC at 11230 which will be the important level to watch in the coming week. Value for the week was overlapping to lower at 11180-11230-11308 so the auction will need to get above 11325-340 for a move towards 11432-450 & 11574 and on the downside staying below 11230 could lead to a test of 11180 & the important zone of 11090-73.
Weekly Hypos for Nifty (Spot):
A) Nifty needs to get above 11324-343 & sustain for a move to 11396-400 / 11432-450 & 11487-503
B) Immediate support is at 11255-230 below which the auction could test 11184-179 / 11142-127 & 11090-73
C) Above 11503, Nifty can probe higher to 11554-574* / 11611-630 & 11665
D) Below 11073, lower levels of 11025-04 / 10973-960 & 10890-869 could come into play
E) If 11665 is taken out & sustained, Nifty can have a fresh leg up to 11707-719 / 11766-773 & 11811-818
F) Break of 10869 could bring lower levels of 10838*-817 / 10765-745 & 10713-708
NF (Weekly Profile)
11312 [11385 / 11113]
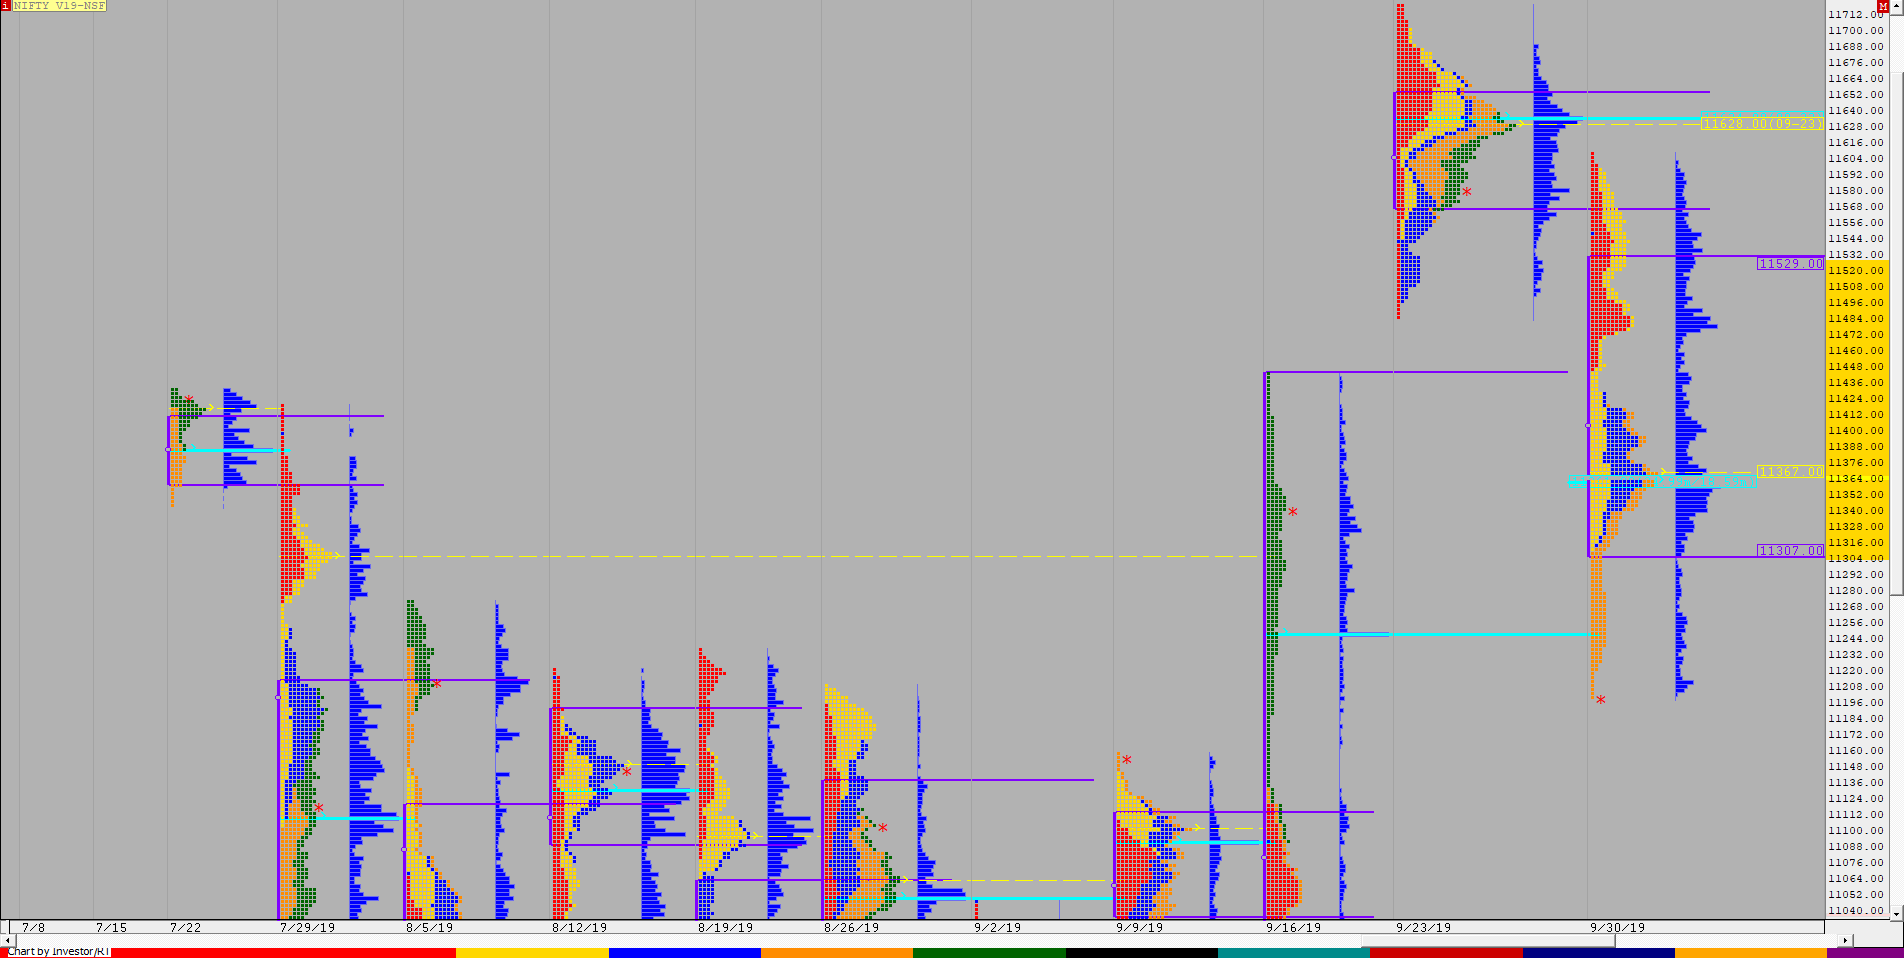
NF started the week with a probe lower on Monday as it broke below previous week’s low of 11201 and tagged 11148 with a spike at close which confirmed a FA at day’s high of 11262. The auction continued this imbalance to the downside on Wednesday as it made new lows of 11122 in the IB & went on to make the dreaded ‘C’ period extension lower which was swiftly rejected as NF confirmed a FA at 11113 on both the daily as well as weekly timeframe which was a very bullish signal and this led to a 4.5 IB extension happening on the upside as it made highs of 11363 & in the process negated the previous day’s FA of 11262 & also completed the 1 ATR objective from the daily perspective. The Neutral Extreme reference was then rejected on Thursday as the auction opened with a big gap down & made an inside day filling up the low volume zone of the previous day. On Friday, NF opened strong giving an drive up as it got above PDH & went on to make new highs for the week at 11385 within the IB but was swiftly rejected and turned the auction completely on its head making a huge move down of 200 points as it hit 11185 in the ‘D’ period. This move down seemed to be more emotional and could have been caused by the late longs liquidating as NF left a buying tail at lows after which it gave a retracement to 11365 before closing at 11312 leaving a balanced weekly profile with mostly lower Value at 11199-11253-11334.
BankNifty Spot Weekly Profile (7th to 11th October)
28042 [ 28858 / 27568 ]
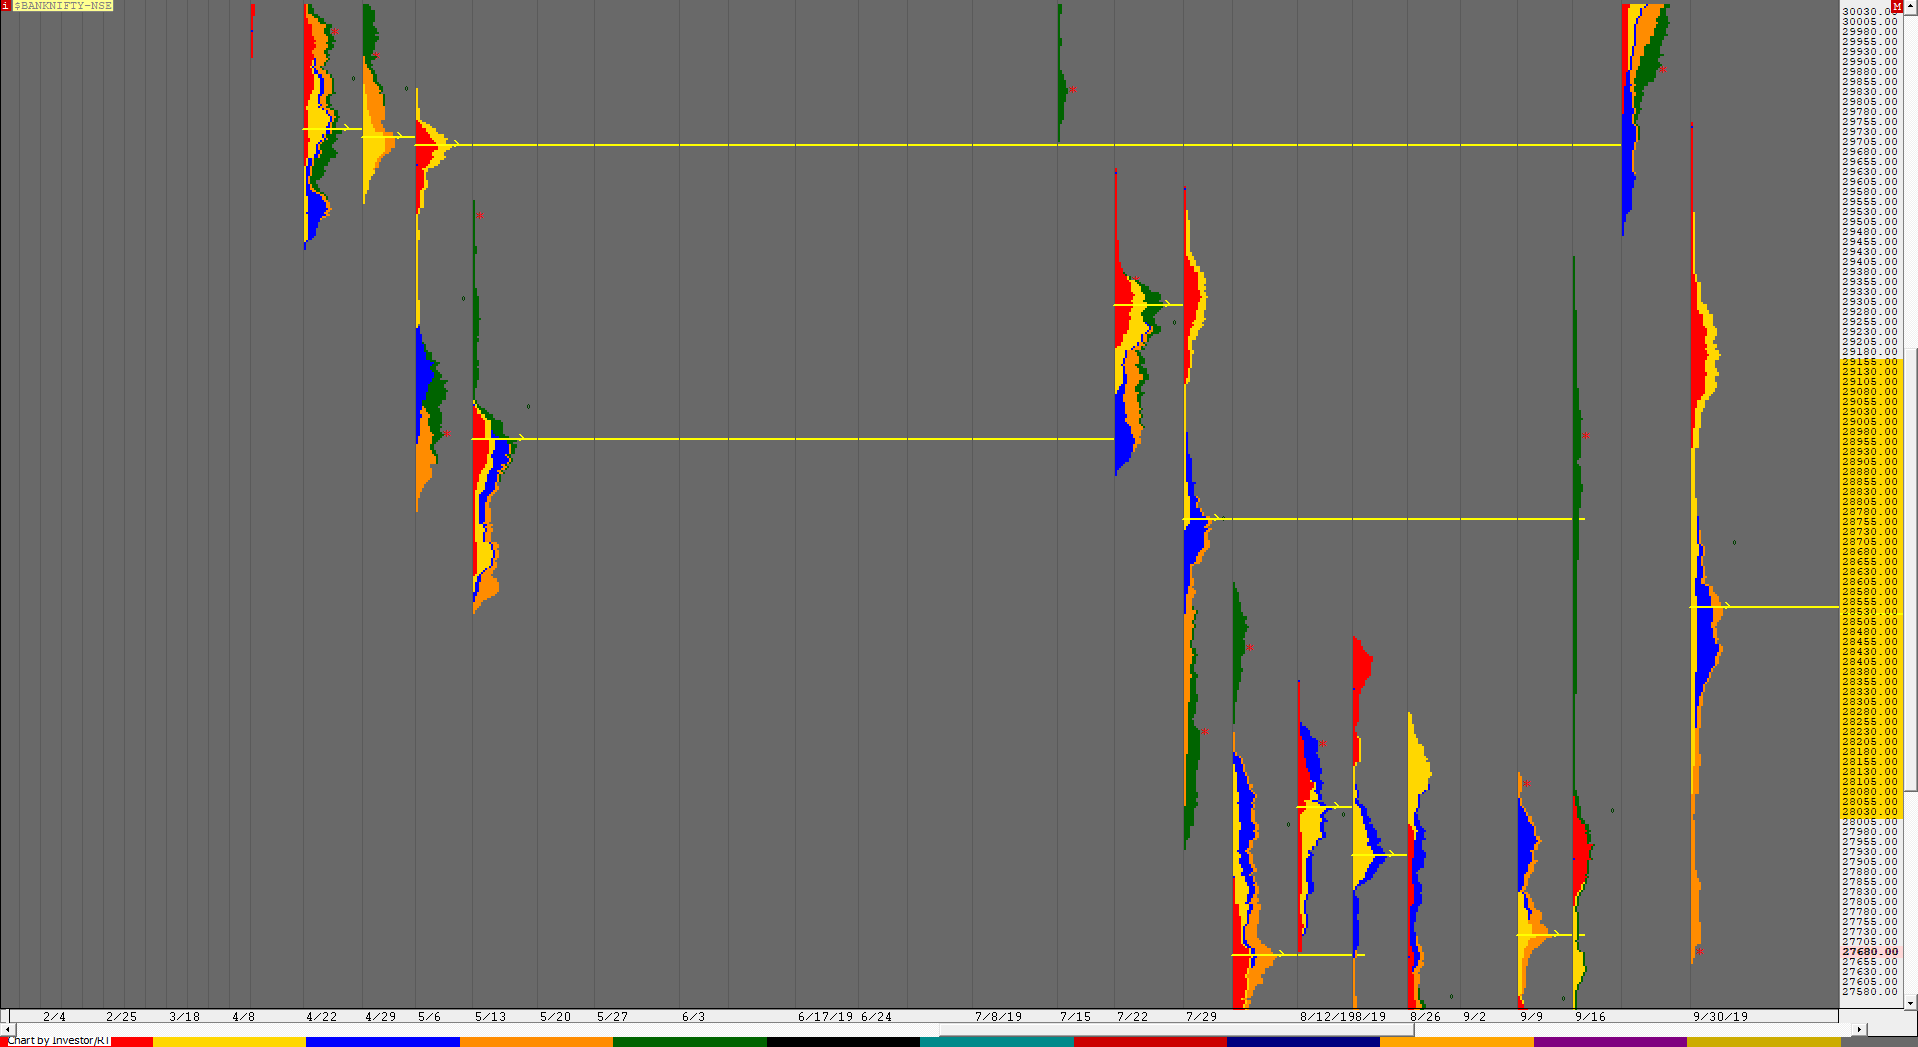
BankNifty had a volatile start to the week giving an indication of how the week could shape up as it opened at 27910 with a big gap up on Monday which was swiftly rejected as it drove lower in the opening minutes and went on to break the previous week’s low as it hit 27568 but could not sustain and reversed the probe to the upside as it not only made new highs but scaled into previous week’s Value to make a high of 28185 leaving a big IB range as it balanced for most of the day inside it forming a ‘p’ shape profile with a long buying tail from 27832 to 27568 but gave a spike lower into the close testing the tail as it closed at 27767. The holiday in between helped the auction to open a bit higher on Wednesday but stayed below the weekly Value in the IB after which it made a RE to the downside in the ‘C’ period but could not sustain below the IBL for 30 minutes which led to a FA being confirmed at the day’s low of 27702 and this led to a huge trending move to the upside as BankNifty not only got into the weekly Value but also went on to tag the POC of 28530 above which it completed the 1 ATR objective of 28611 before spiking higher into the close leaving a Neutral Extreme Day with the reference at 28675 to 28858. The auction opened the next day with a big gap down of more than 200 points with an almost OH start at 28543-28553 and drove lower not just rejecting the Neutral Extreme profile of previous day but retraced the entire upmove as it gave a Trend Day down to make lows of 27914 before closing at 28013. BankNifty continued the two-way mode on Friday as it once again rejected the previous day’s move to open with yet another gap of more than 200 points but this time it was to the upside after which it continued to drive higher to scale above PDH but was still unable to get into the Neutral Extreme reference and this led to a big liquidation post IB as the auction not only closed the gap up but went on to break below the PDL completing the 2 IB objective for the day in the ‘D’ period itself as it hit lows of 27736 but stalled just above the FA of 27702 to give a retracement back to 28259 before closing at 28042 which was the prominent POC of the 3-1-3 balanced weekly profile. The Value for the week is 27745-28035-28205 with the tail at top from 28605 to 28858 and tail at lows from 27702 to 27568.
Weekly Hypos for Bank Nifty (Spot):
A) BankNifty needs to sustain above 28090 for a move to 28141-150 / 28205 / 28260-279 & 28384-416
B) Staying below 28035, the auction could test 27975 / 27914-889 / 27833-806 & 27745-702
C) Above 28416, BankNifty can probe higher to 28477-490 / 28560-565 / 28605-640 & 28731
D) Below 27702, lower levels of 27652-640 / 27568-555 / 27495-475 & 27405-390 could come into play
E) If 28731 is taken out, BankNifty could rise to 28822 / 28910-945 / 28990 & 29034-71
F) Break of 27390 could trigger a move lower to 27310 / 27225 / 27160-143 & 27060-25
G) Sustaining above 29071, the auction can tag higher levels of 29155 / 29210-242 / 2927-350 & 29415
H) Staying below 27025, BankNifty can probe down to 26979-983 / 26895-880 / 26835-815 & 26733-721
BNF (Weekly Profile)
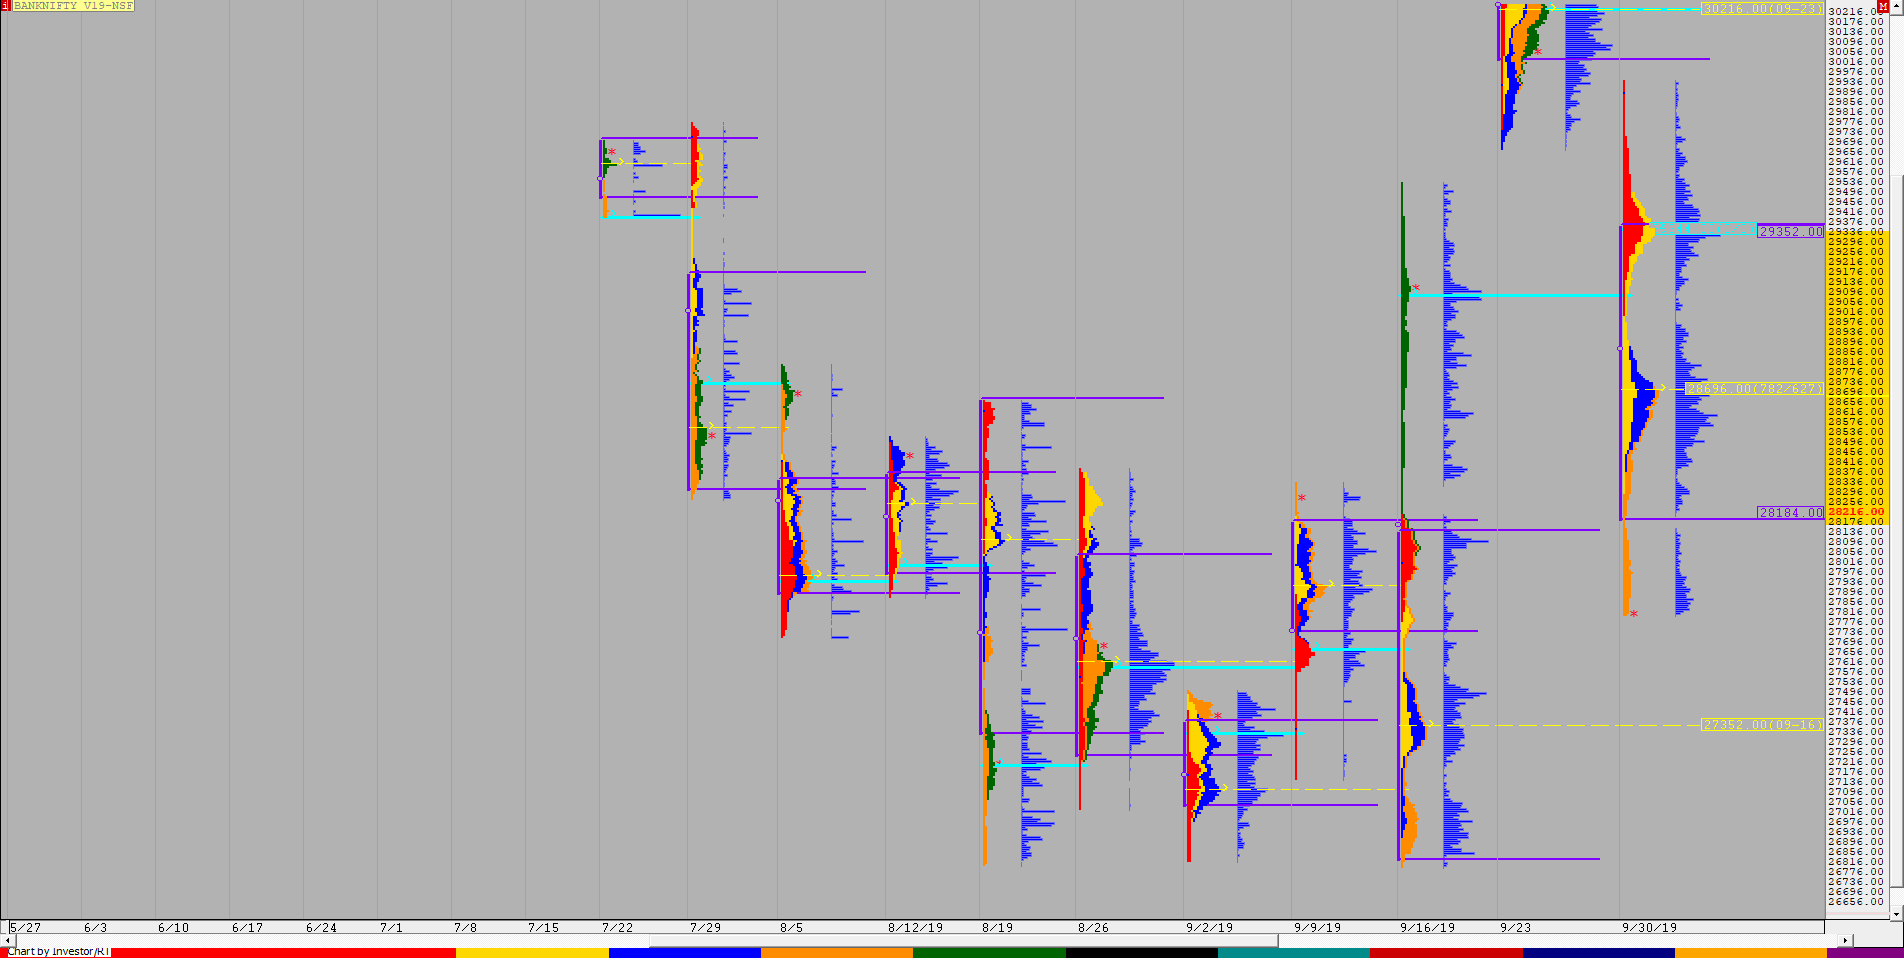
27854 [ 29956 / 27778 ]
BNF has made a 3-1-3 profile for the week with the selling tail from 28723 to 28990 and the singles at lows from 27774 to 27652 with a bulging Value area at 27880-28152-28368. Important reference for the coming week would be the prominent POC of 28152 from where it could give a move away but would need to do it on volumes for a trending move.


