Love Vtrender Charts? Check out our new offer!
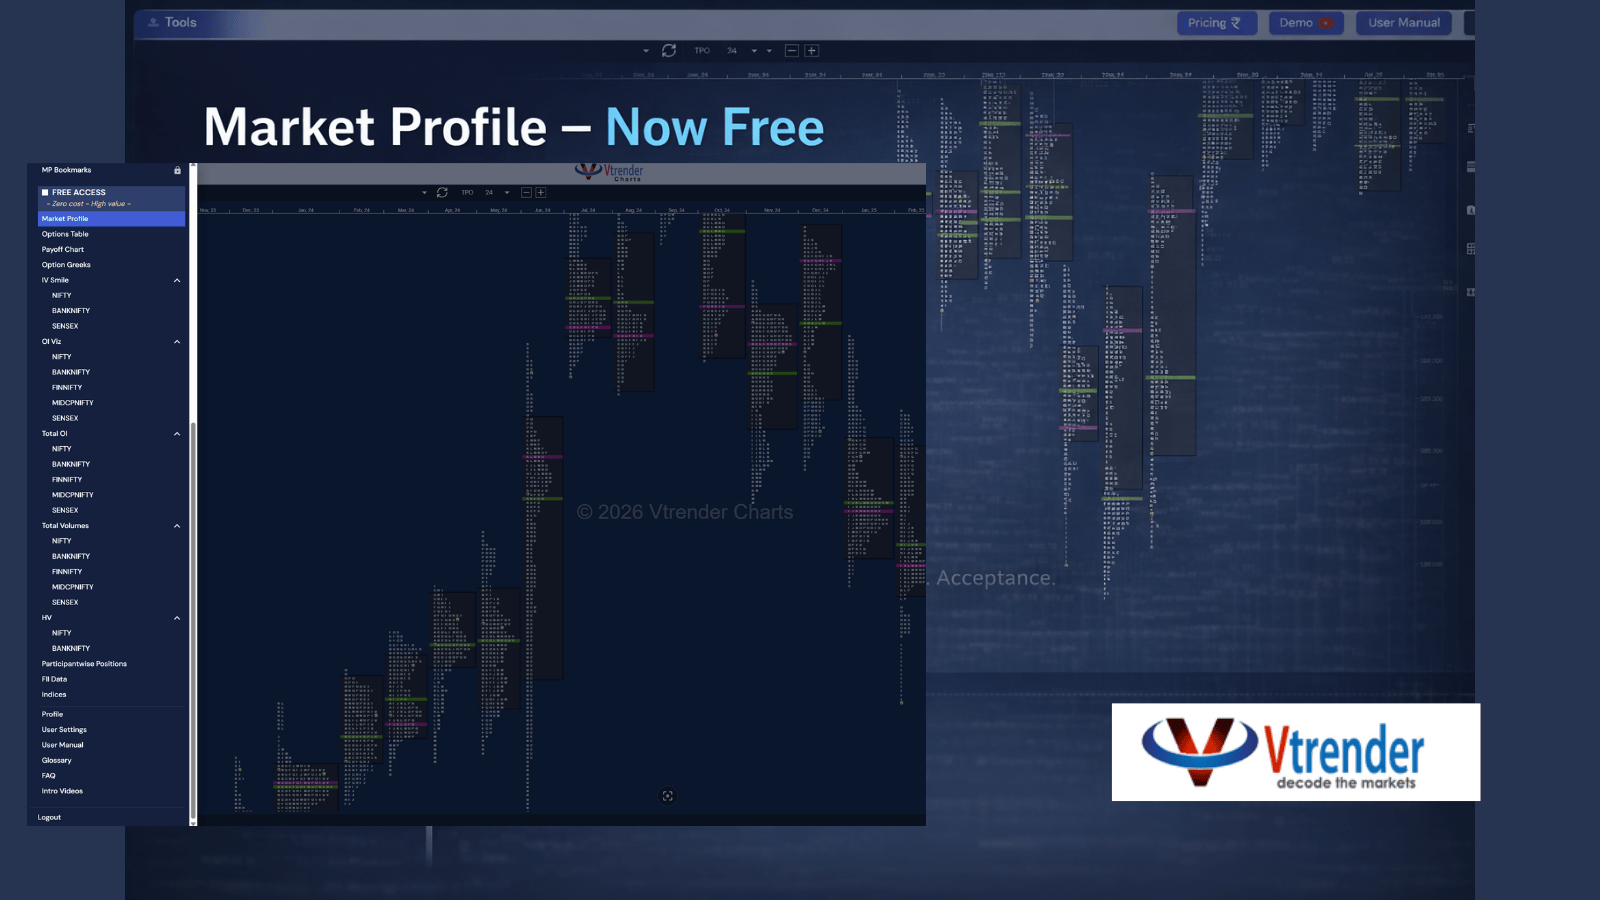
Market Profile charts is now available free on Vtrender Charts. This post breaks down what the free plan contains, how the chart is structured, and what the data actually shows across NIFTY and Sensex timeframes.
Read More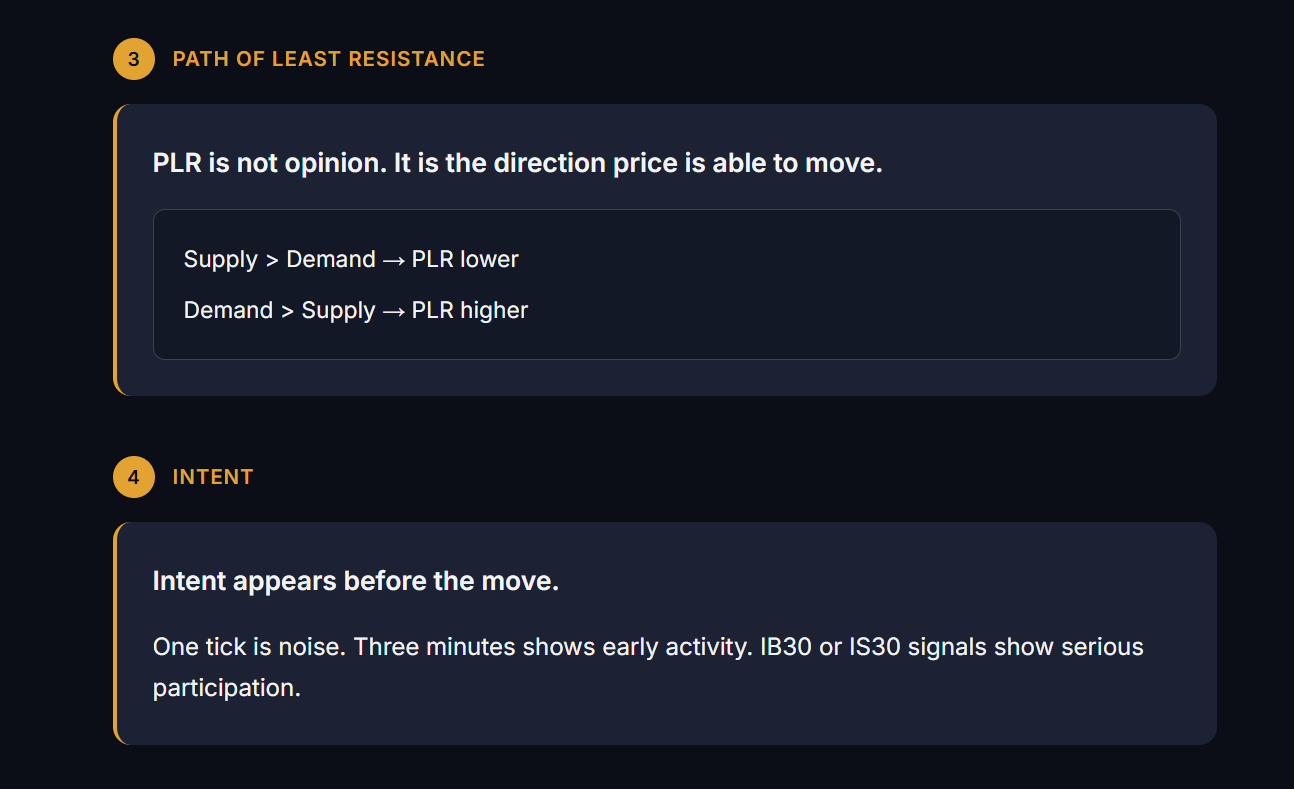
Framework A market is two prices negotiating. Left side: supply. Right side: demand. The candle is the result. Price is the output. Order flow shows the process.
Read More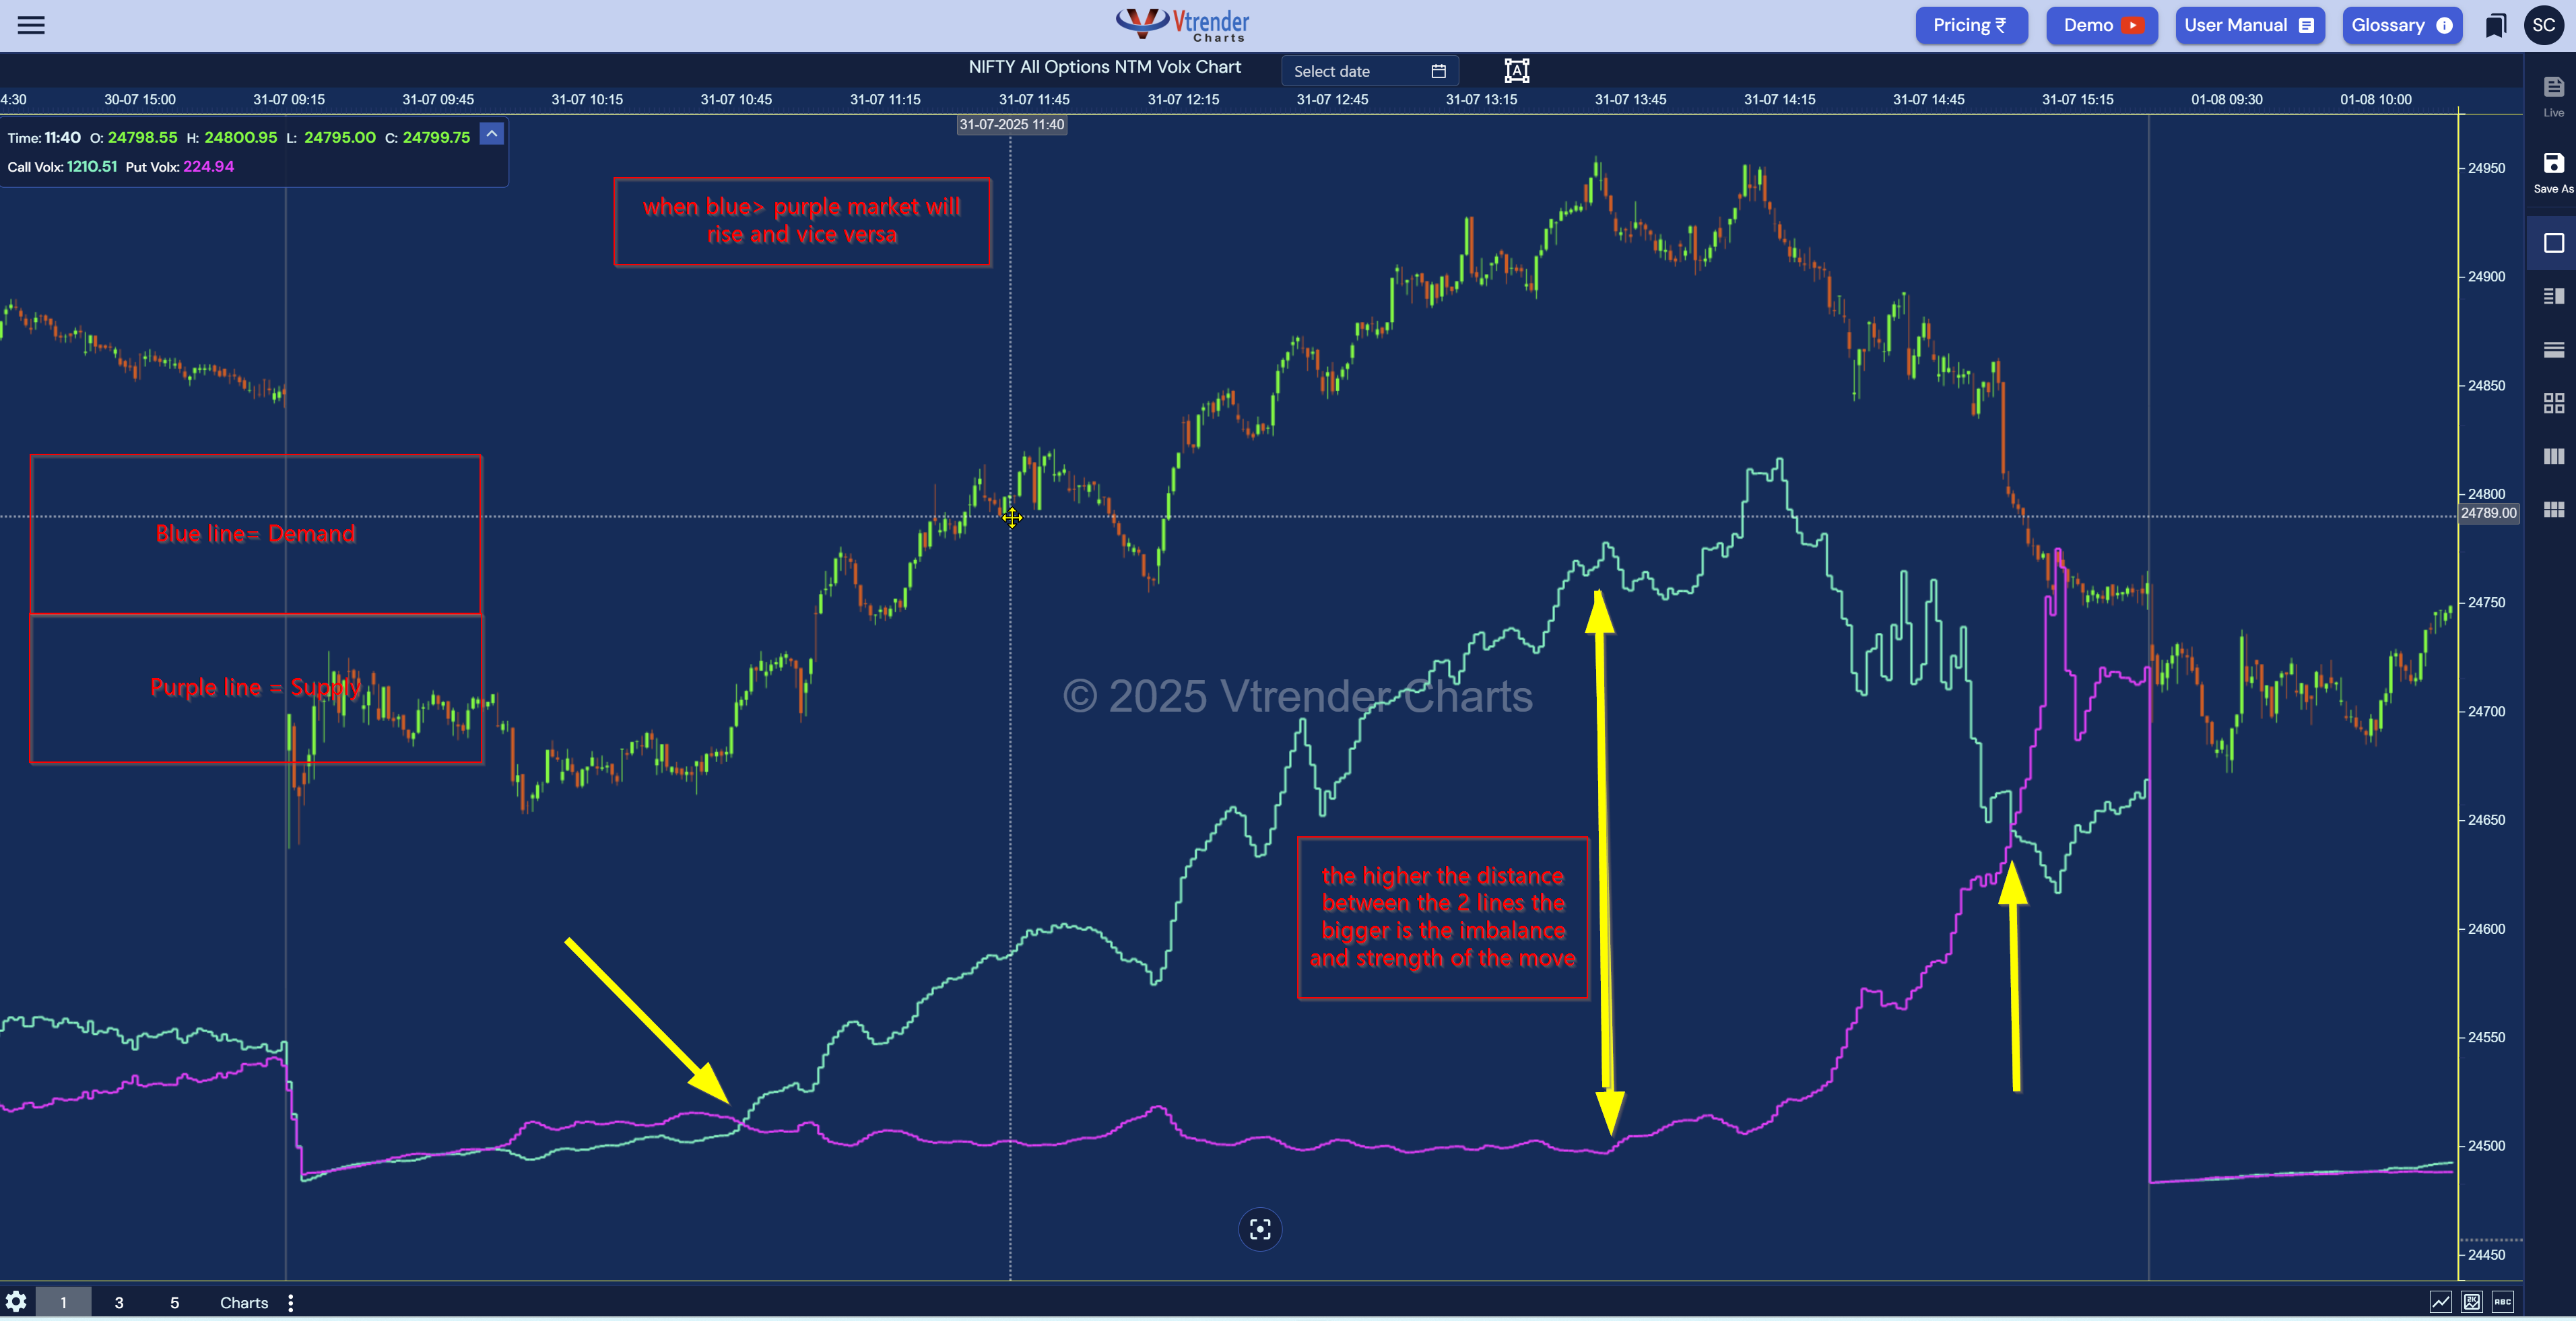
A complete guide to NTM Volx. Understand VXR ranges (1.0 to 4.0+), interpret volume swipes, and determine who controls the price action: buyers or sellers.
Read More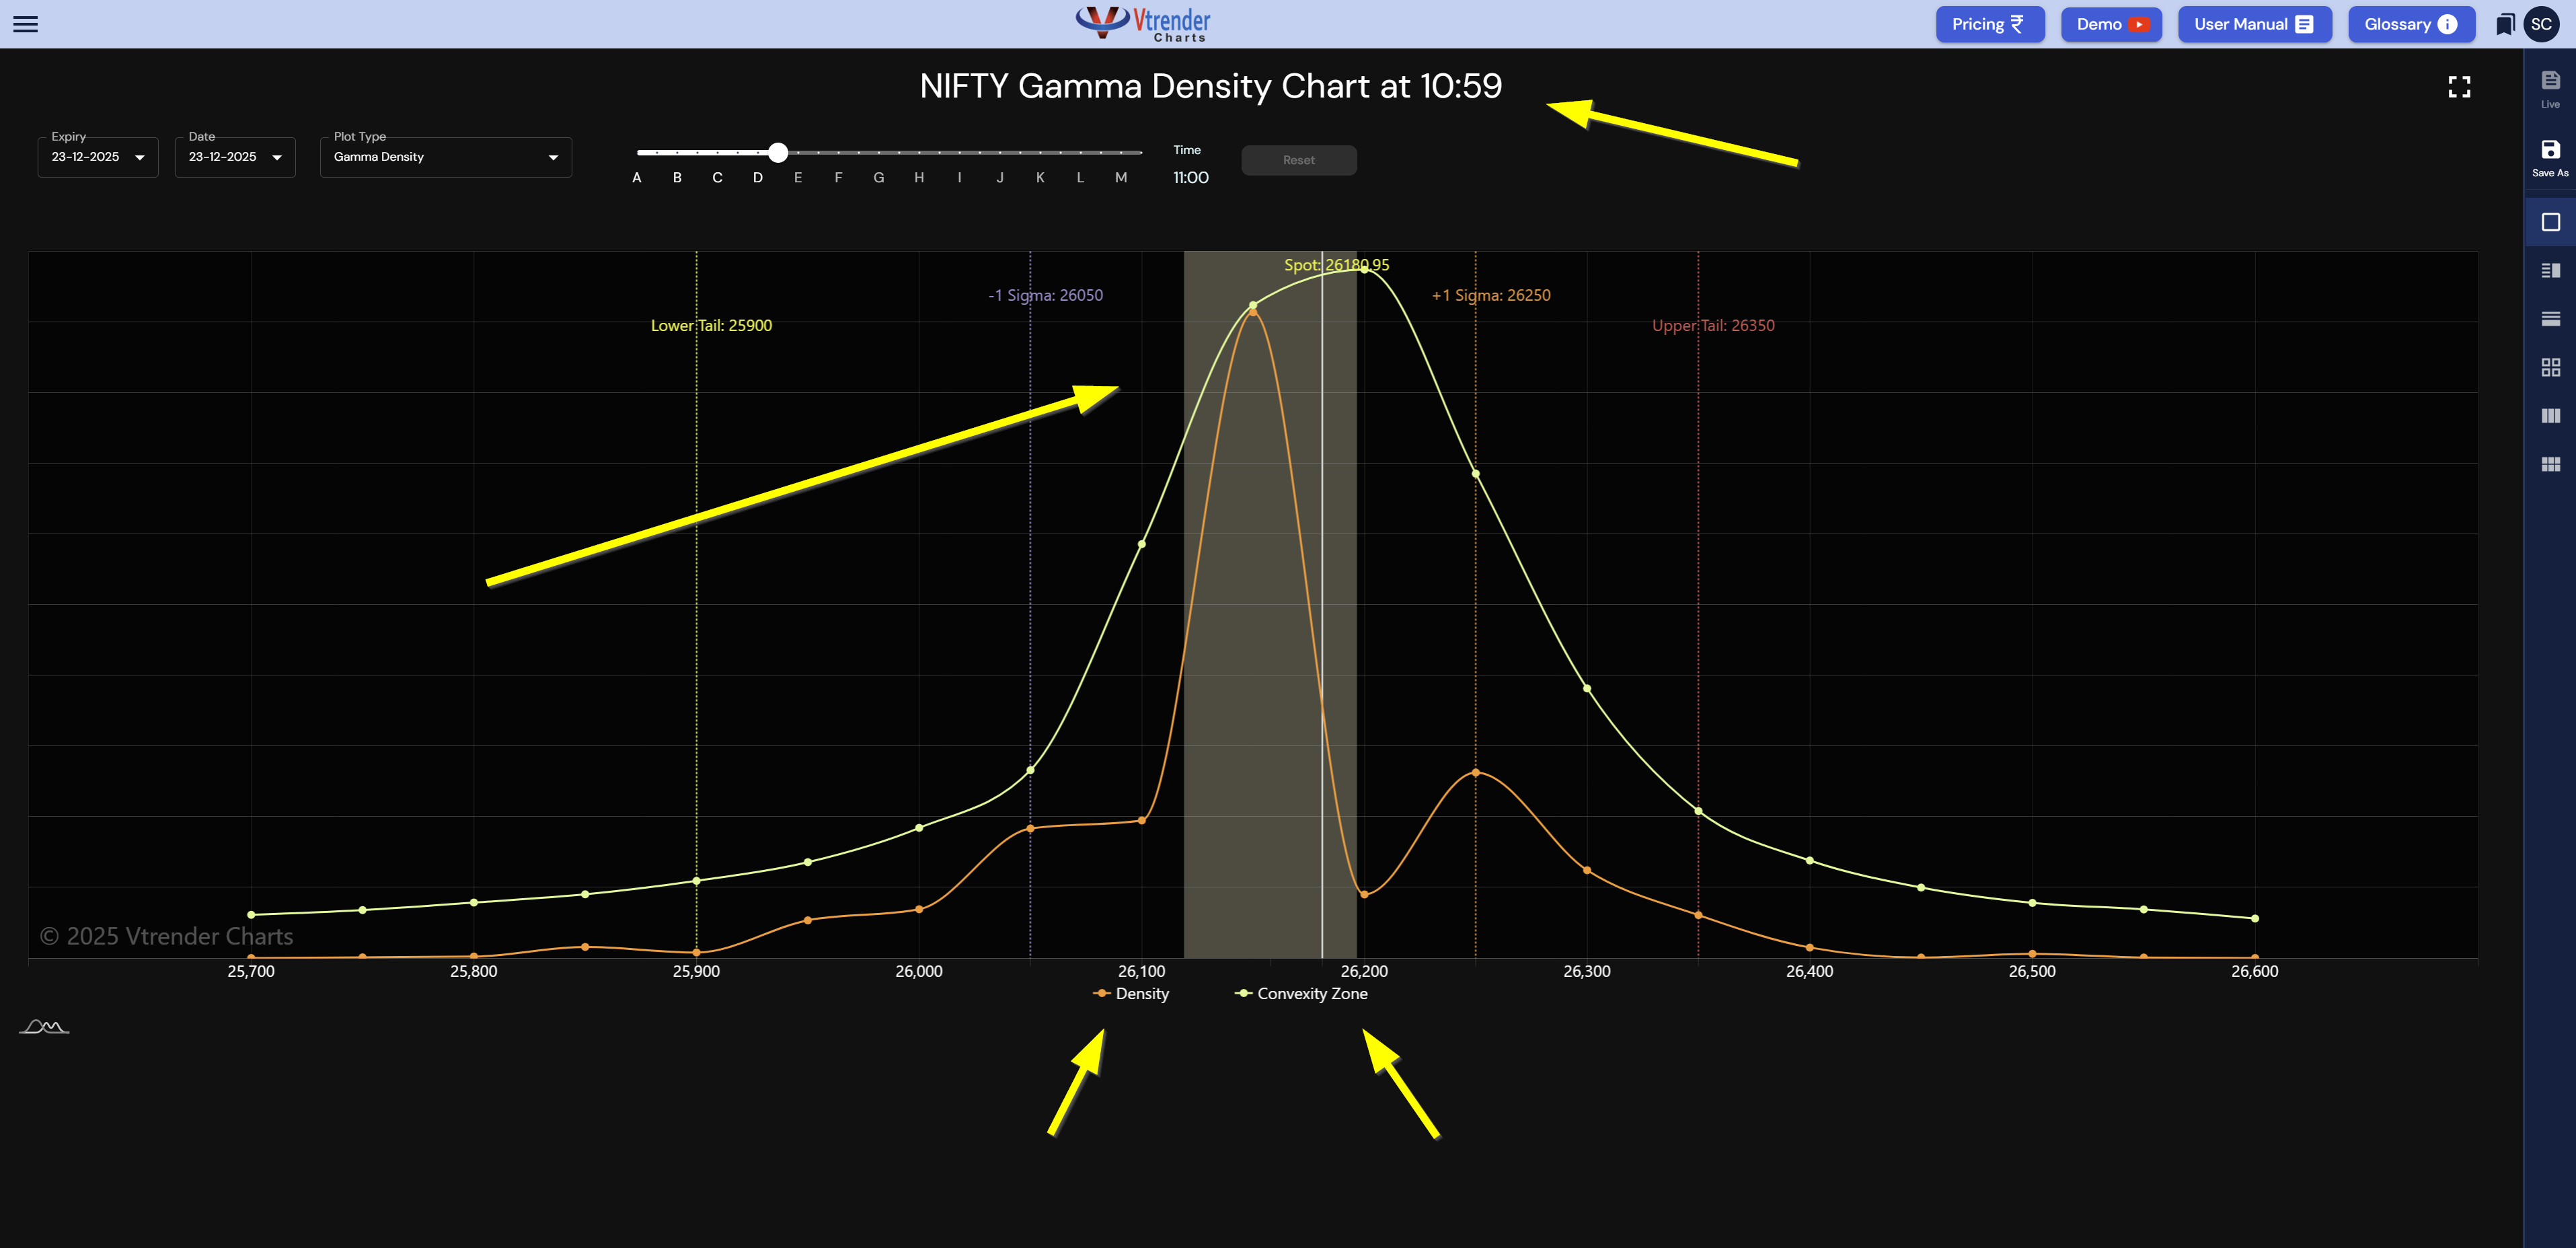
This post is about how to use Gamma framework to undertand the positionining in the markets. Go beyond Delta. Learn how Gamma Density acts as market gravity, what Exposure reveals about stability, and how Convexity defines risk in NSE options.
Read More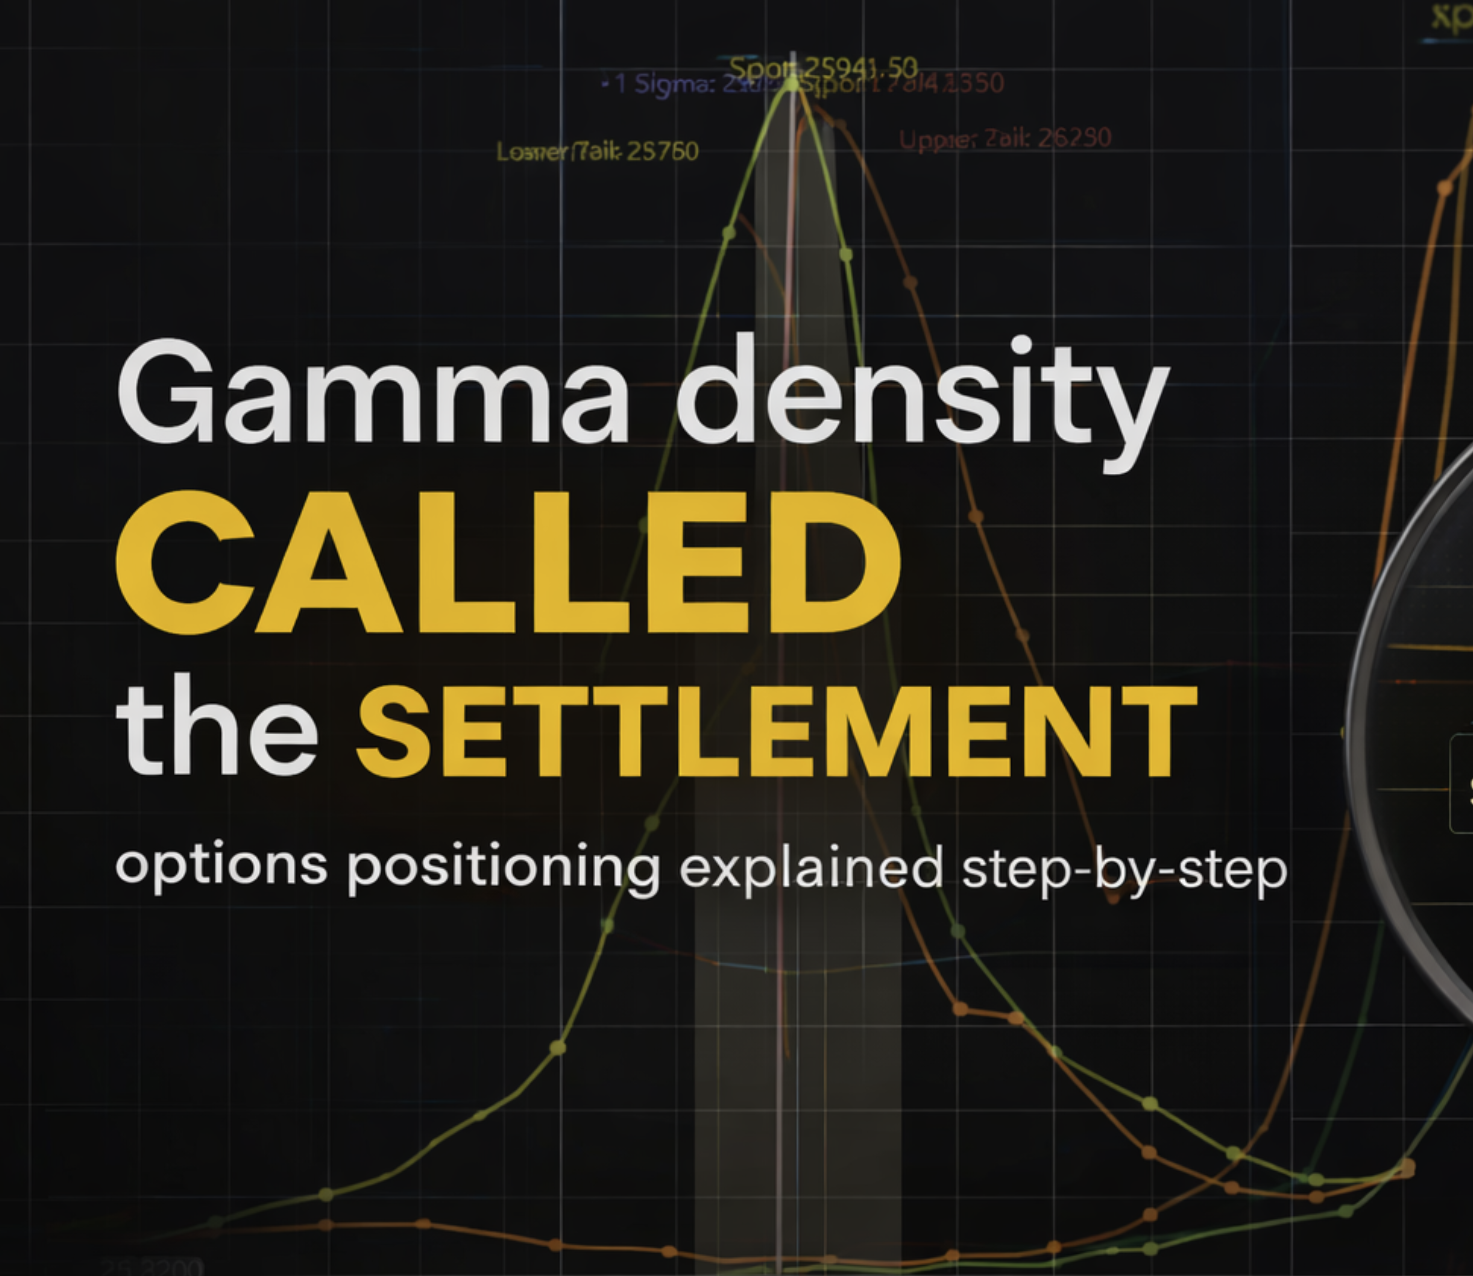
we’re watching how options positioning creates “gravity zones” in price. your gamma charts show where the market is most incentivized to keep price stable and where it can accelerate if pushed. the learning goal is simple: see the magnet → respect the walls → understand the breakout conditions.
Read More
GAMMA PINNING MASTERCLASS Real-Time Case Study: NIFTY Weekly Expiry - December 23, 2025 ₹17,492 Crore OI at One Strike ₹1,000 Crore Peak Gamma Exposure 5.5 Hours of Institutional Pinning A Vtrender Educational Case Study www.vtrender.com
Read More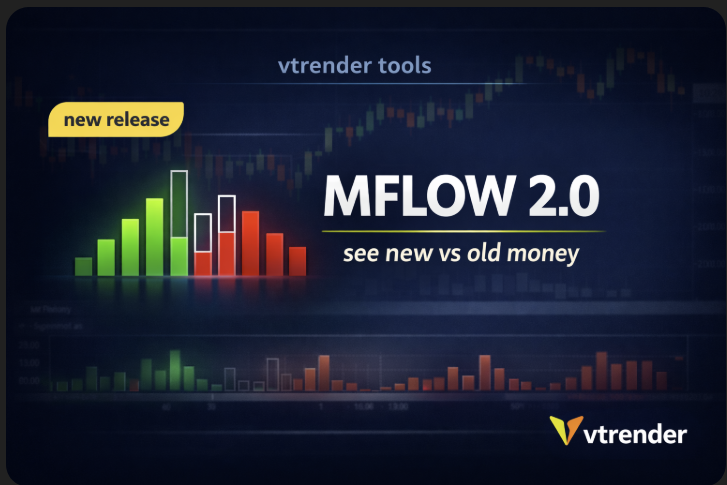
Discover MFlow 2.0, Vtrender’s new money-flow engine that separates new longs, new shorts, short covering and long liquidation—so you can see who’s really driving the move, not just where price went.
Read More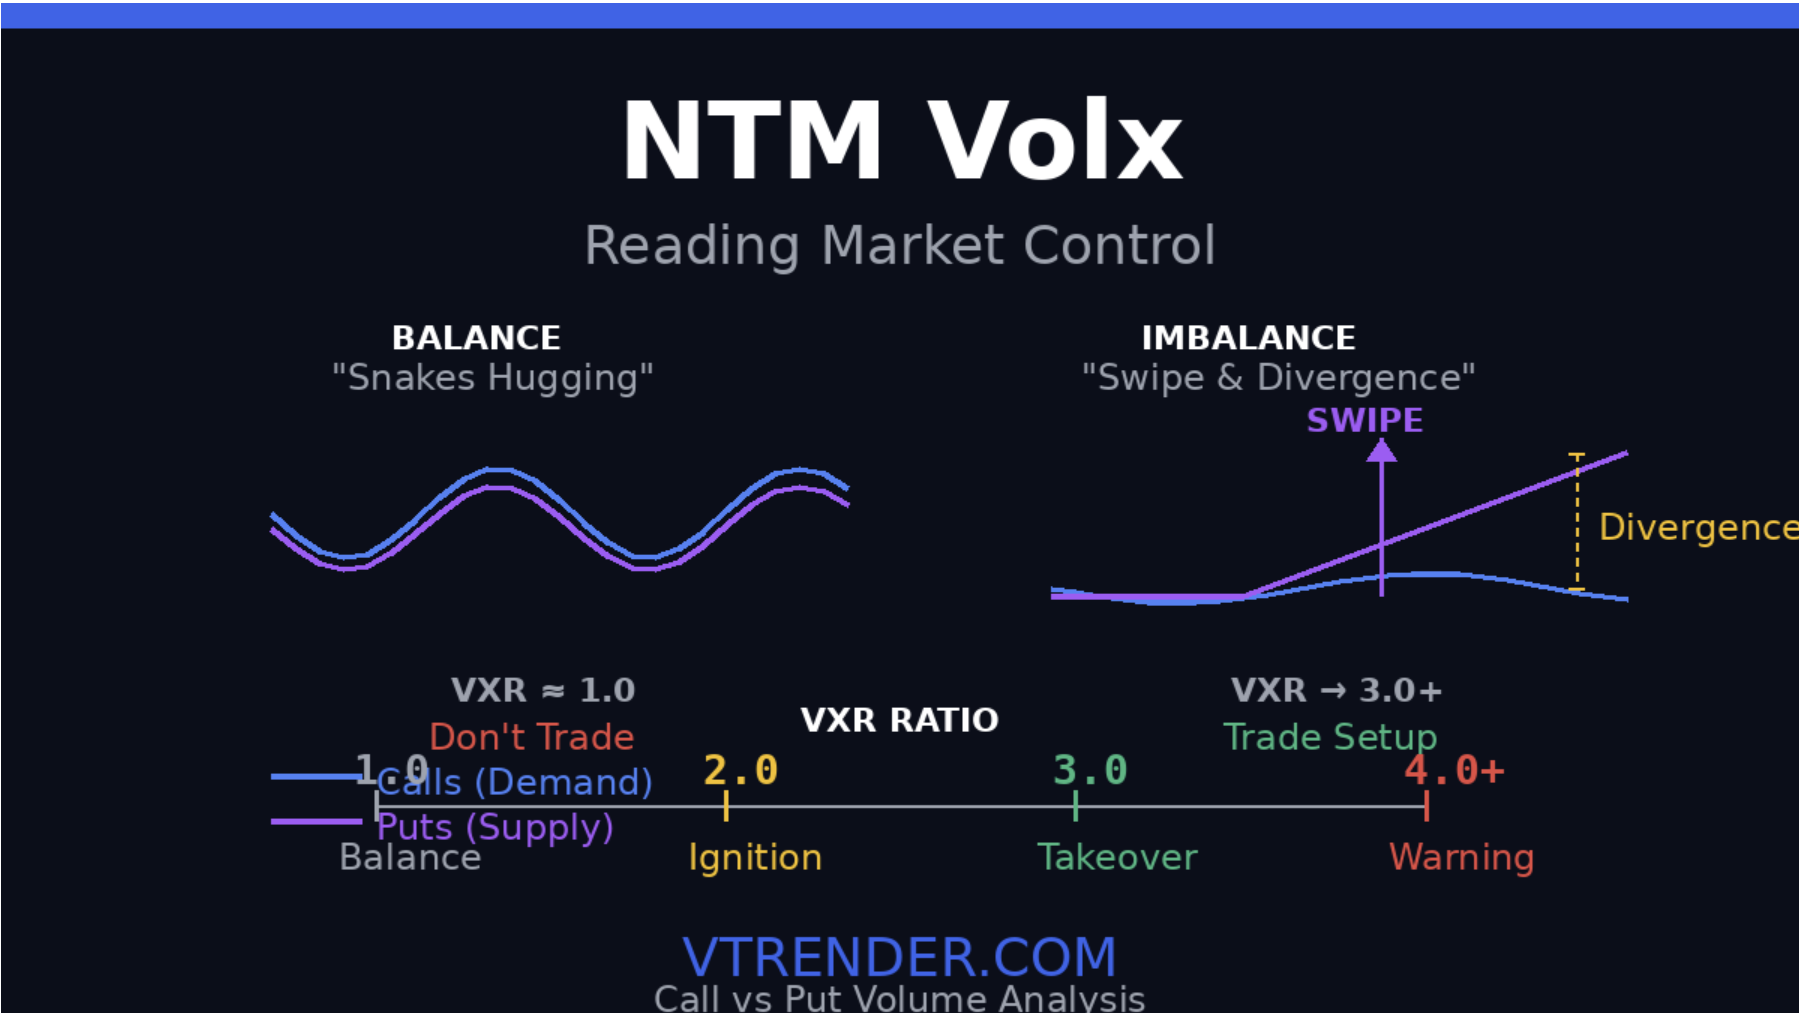
NTM Volx: Reading Control in the Options Market
Read More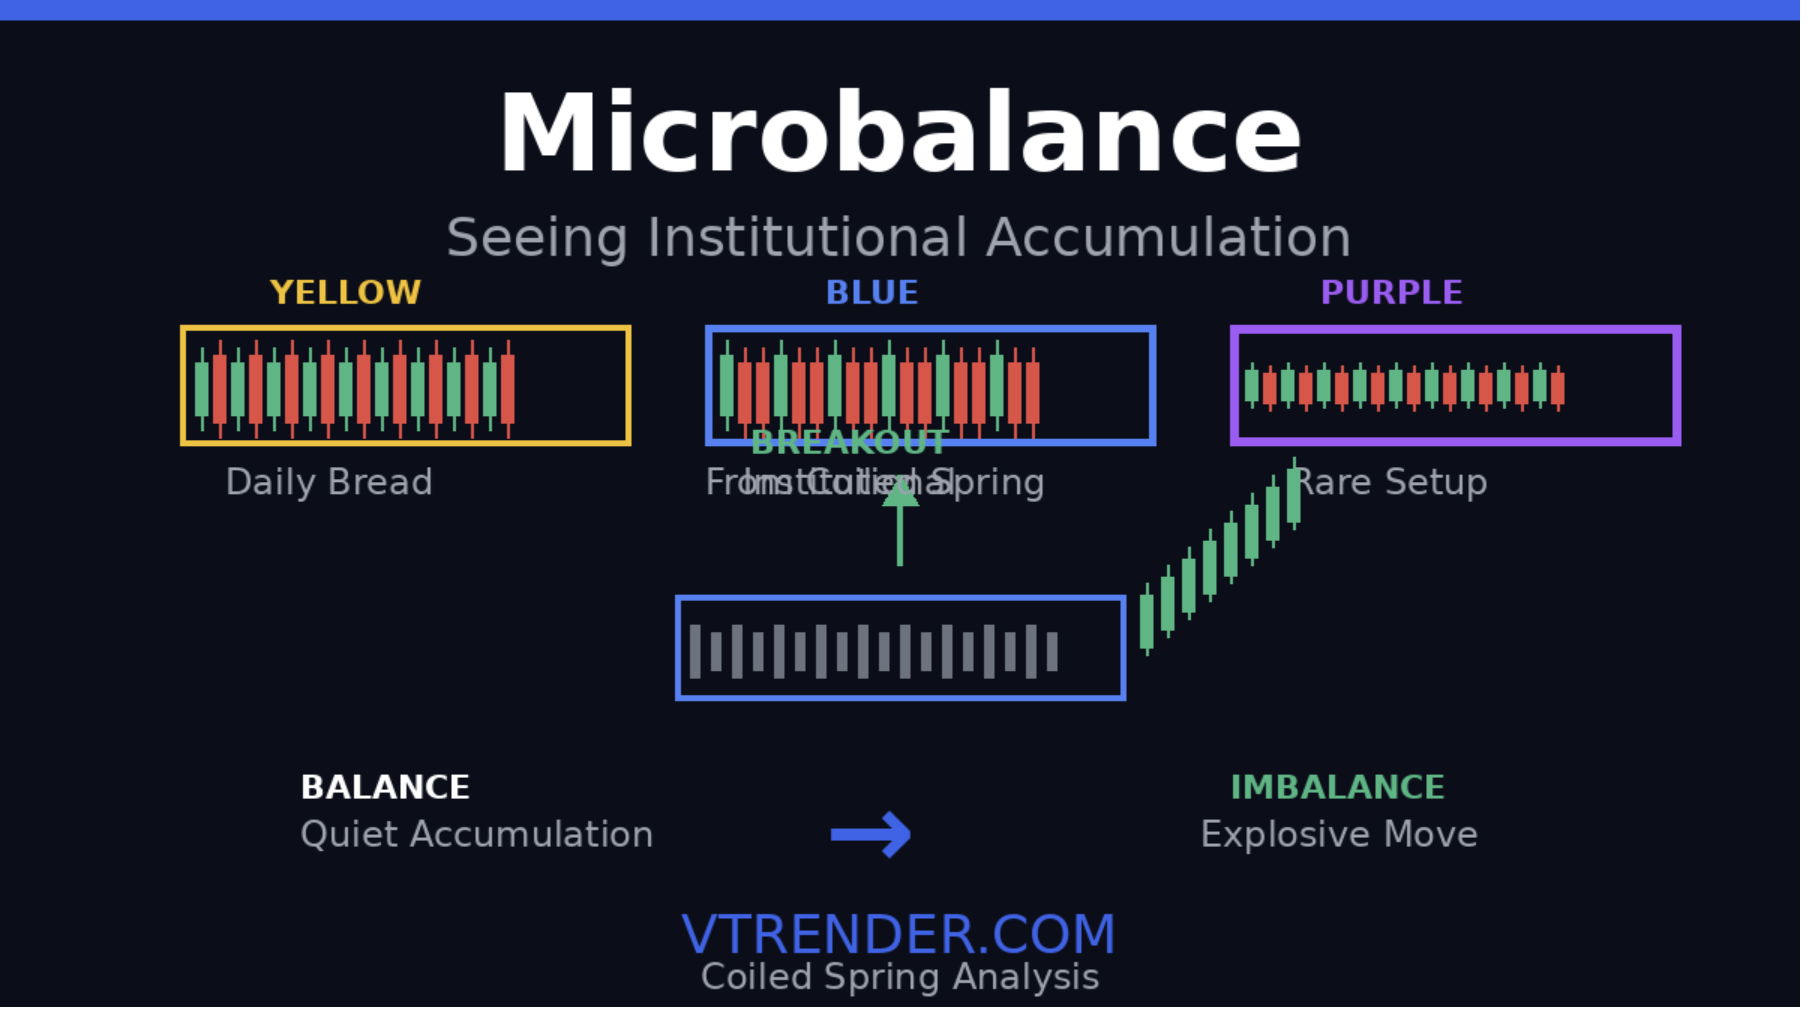
This is the market's dirty secret: the biggest moves are built during the quietest moments. The explosive trends you want to catch are constructed during periods when most traders zone out because price isn't moving.
Read More